

















Imagine the finance head at Nova Industries asks four questions before month-end: what assets do we own, how much depreciation was posted, what value remains, and which assets moved or changed during the month? One list cannot answer all four questions clearly.
ERPNext Asset Reports provide different views for different decisions. Together, the depreciation ledger, depreciation and balances report, fixed asset register, and asset activity report help the team reconcile values and investigate what happened.
Choose the right report
| Field | What it means |
|---|---|
| Asset Depreciation Ledger | Detailed depreciation schedule and posting history for each Asset and Finance Book. |
| Asset Depreciations and Balances | Opening value, additions, depreciation, adjustments, and closing carrying value. |
| Fixed Asset Register | Operational and financial register with category, status, dates, values, cost center, department, vendor, and location. |
| Asset Activity | Lifecycle events such as purchase, movement, repair, value change, sale, or scrapping. |
Asset Depreciation Ledger
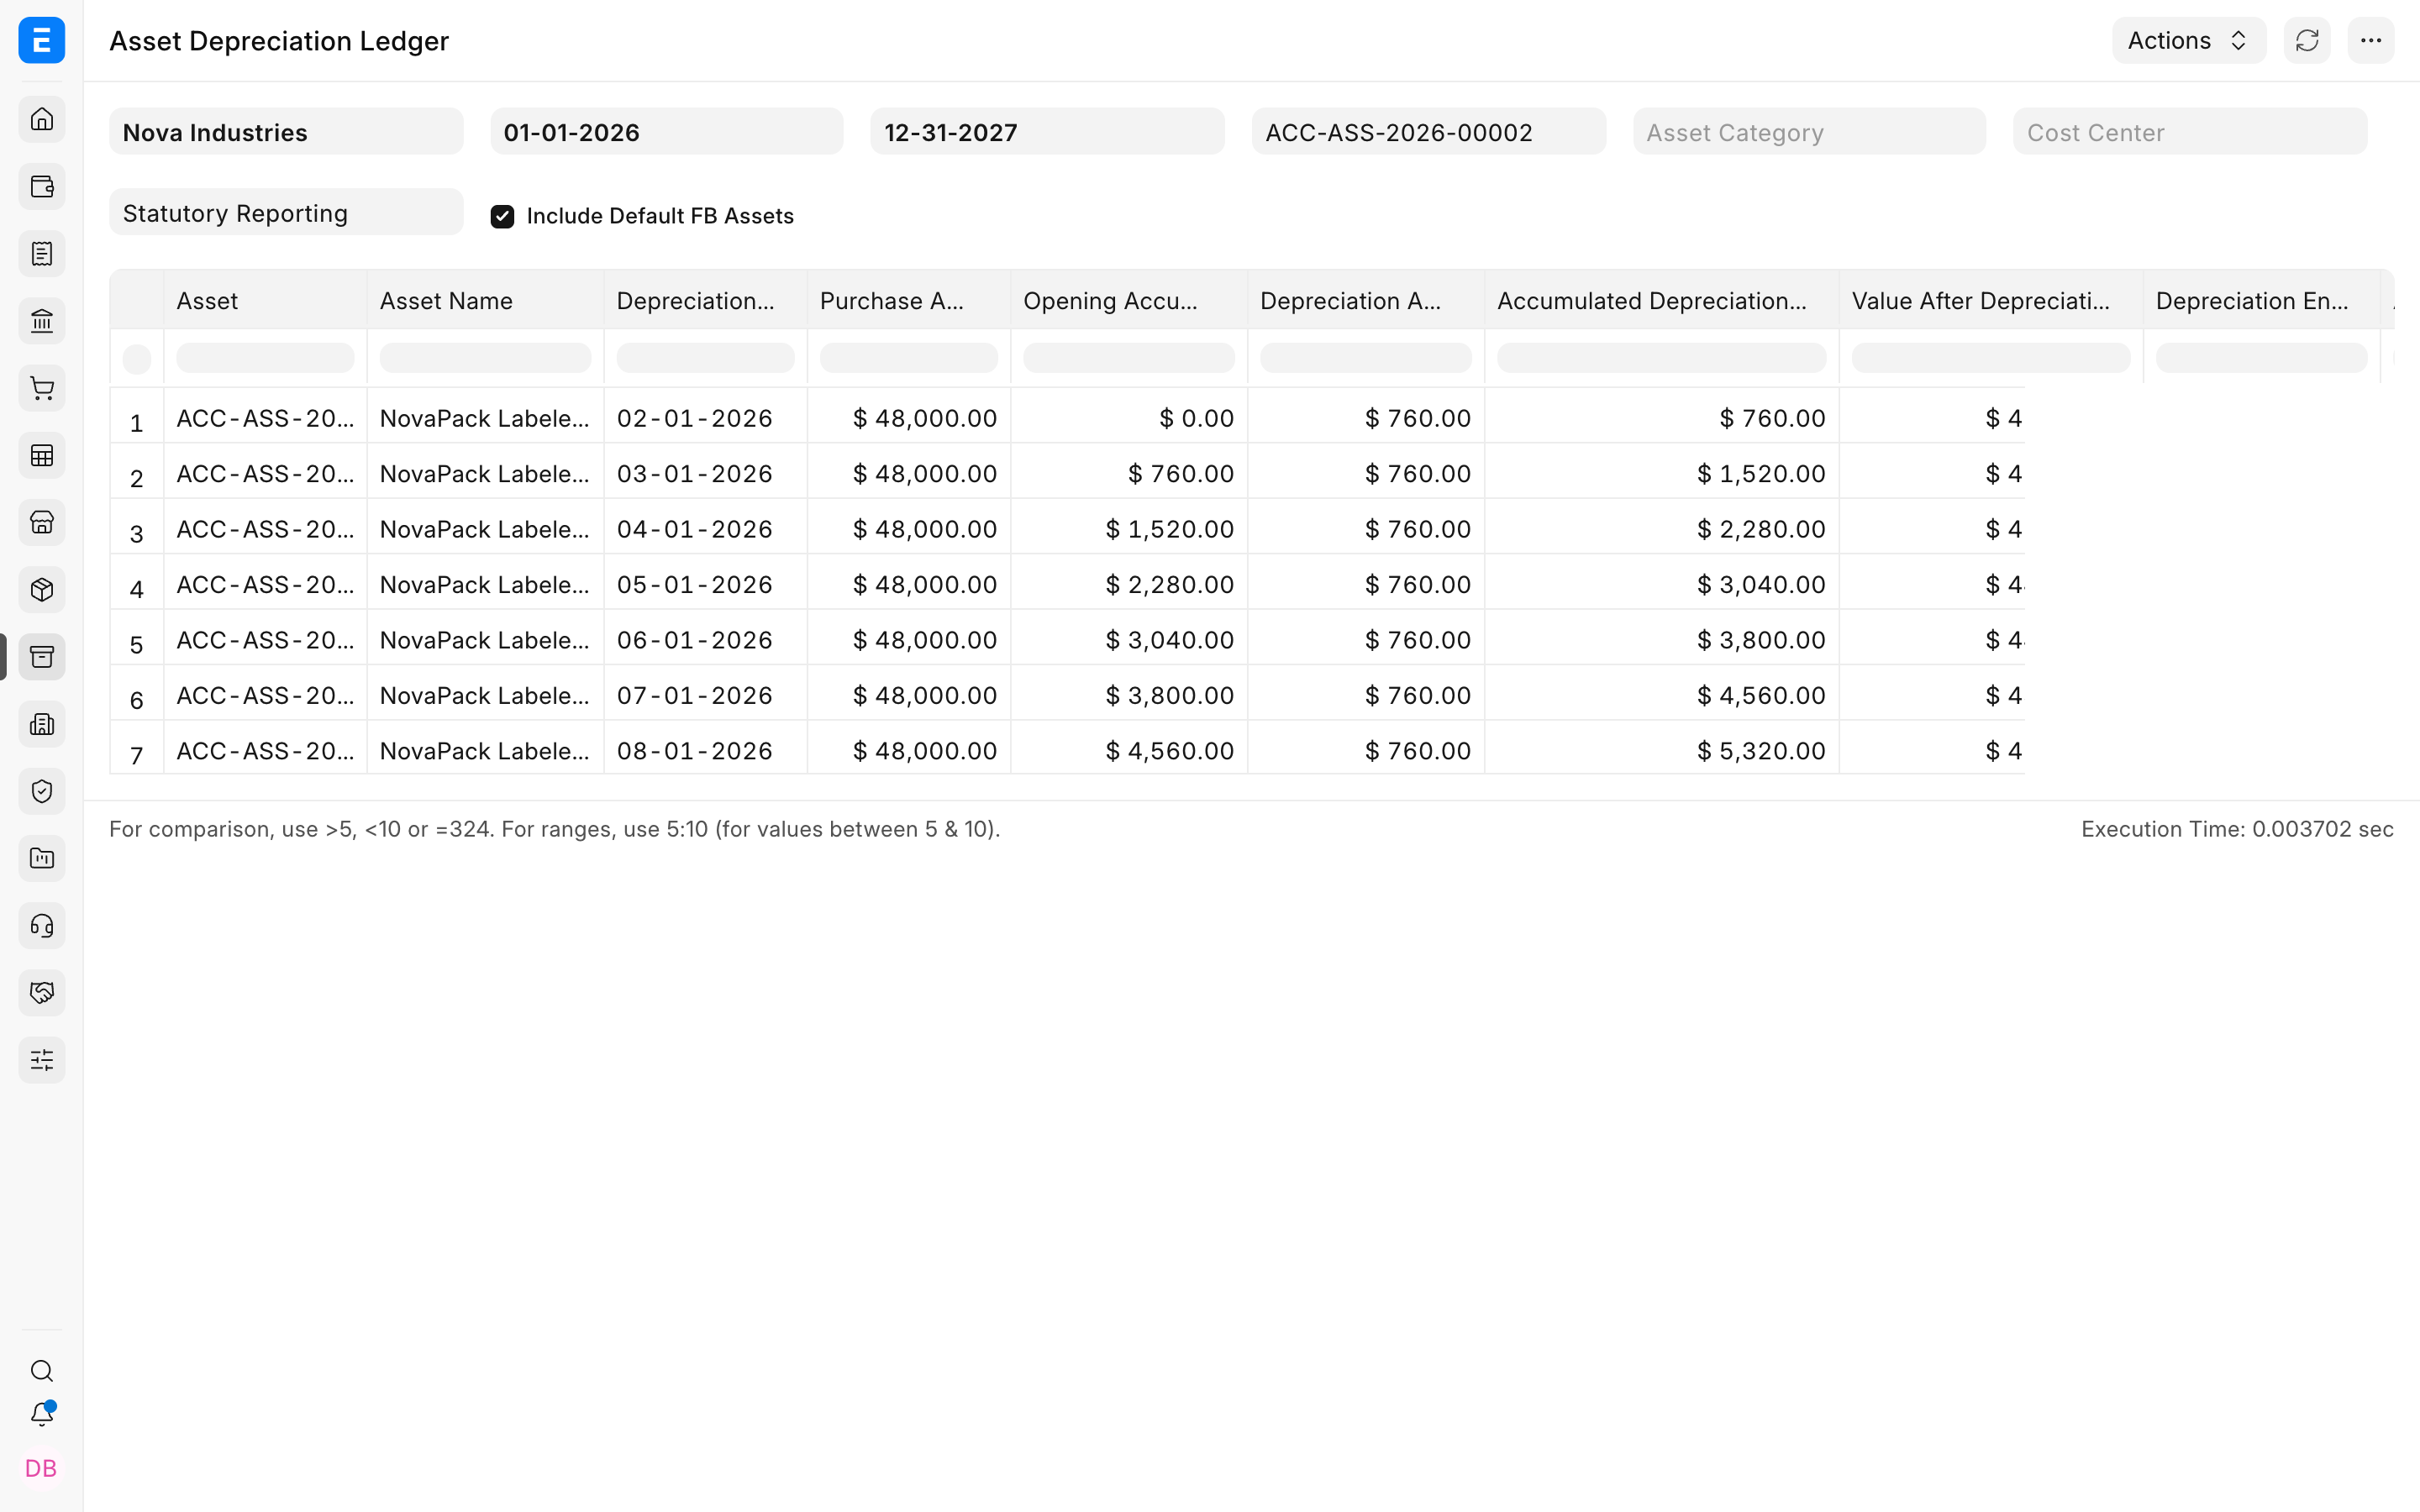
Use this report to investigate a schedule or reconcile posted and pending depreciation rows. Filter by company, date, Asset, category, or Finance Book.
The example below shows seven submitted monthly depreciation entries for Nova Industries' NovaPack labeler. The report makes it possible to trace each $760 expense to its depreciation Journal Entry and follow the accumulated balance.
Asset Depreciations and Balances
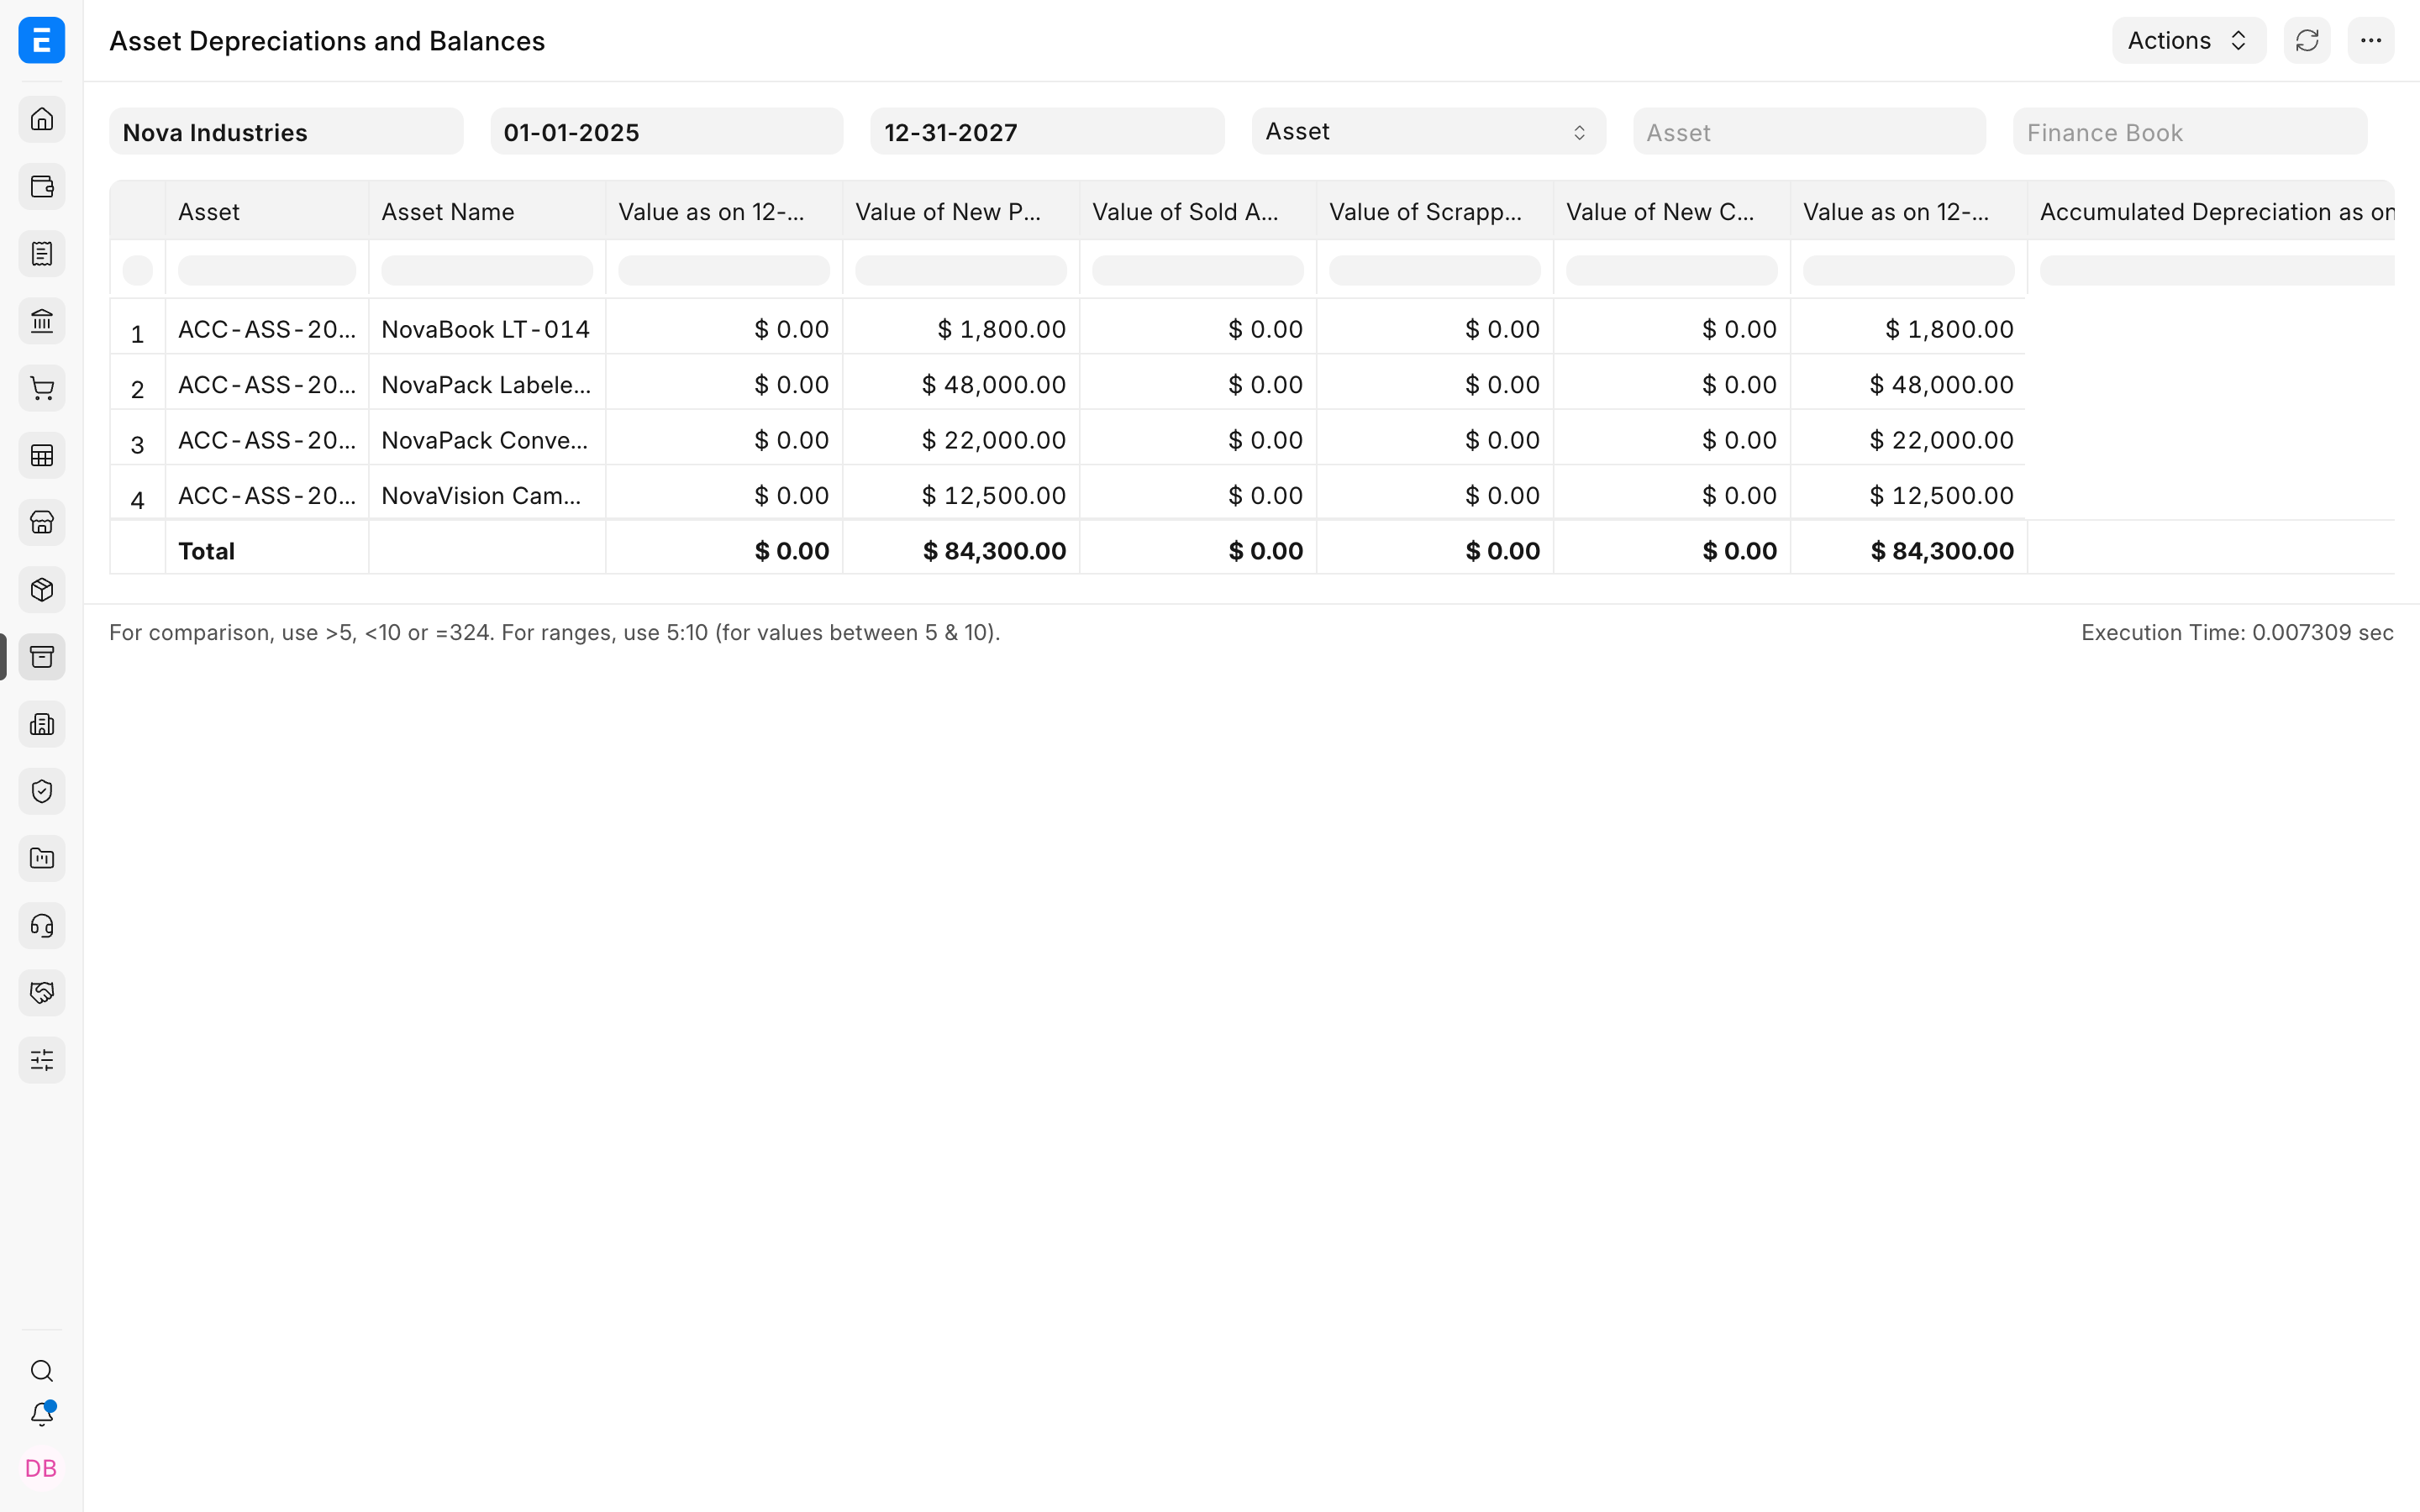
Use it to explain how carrying value changed across a period. It is the strongest starting point for reconciling additions, depreciation, and closing value.
Fixed Asset Register
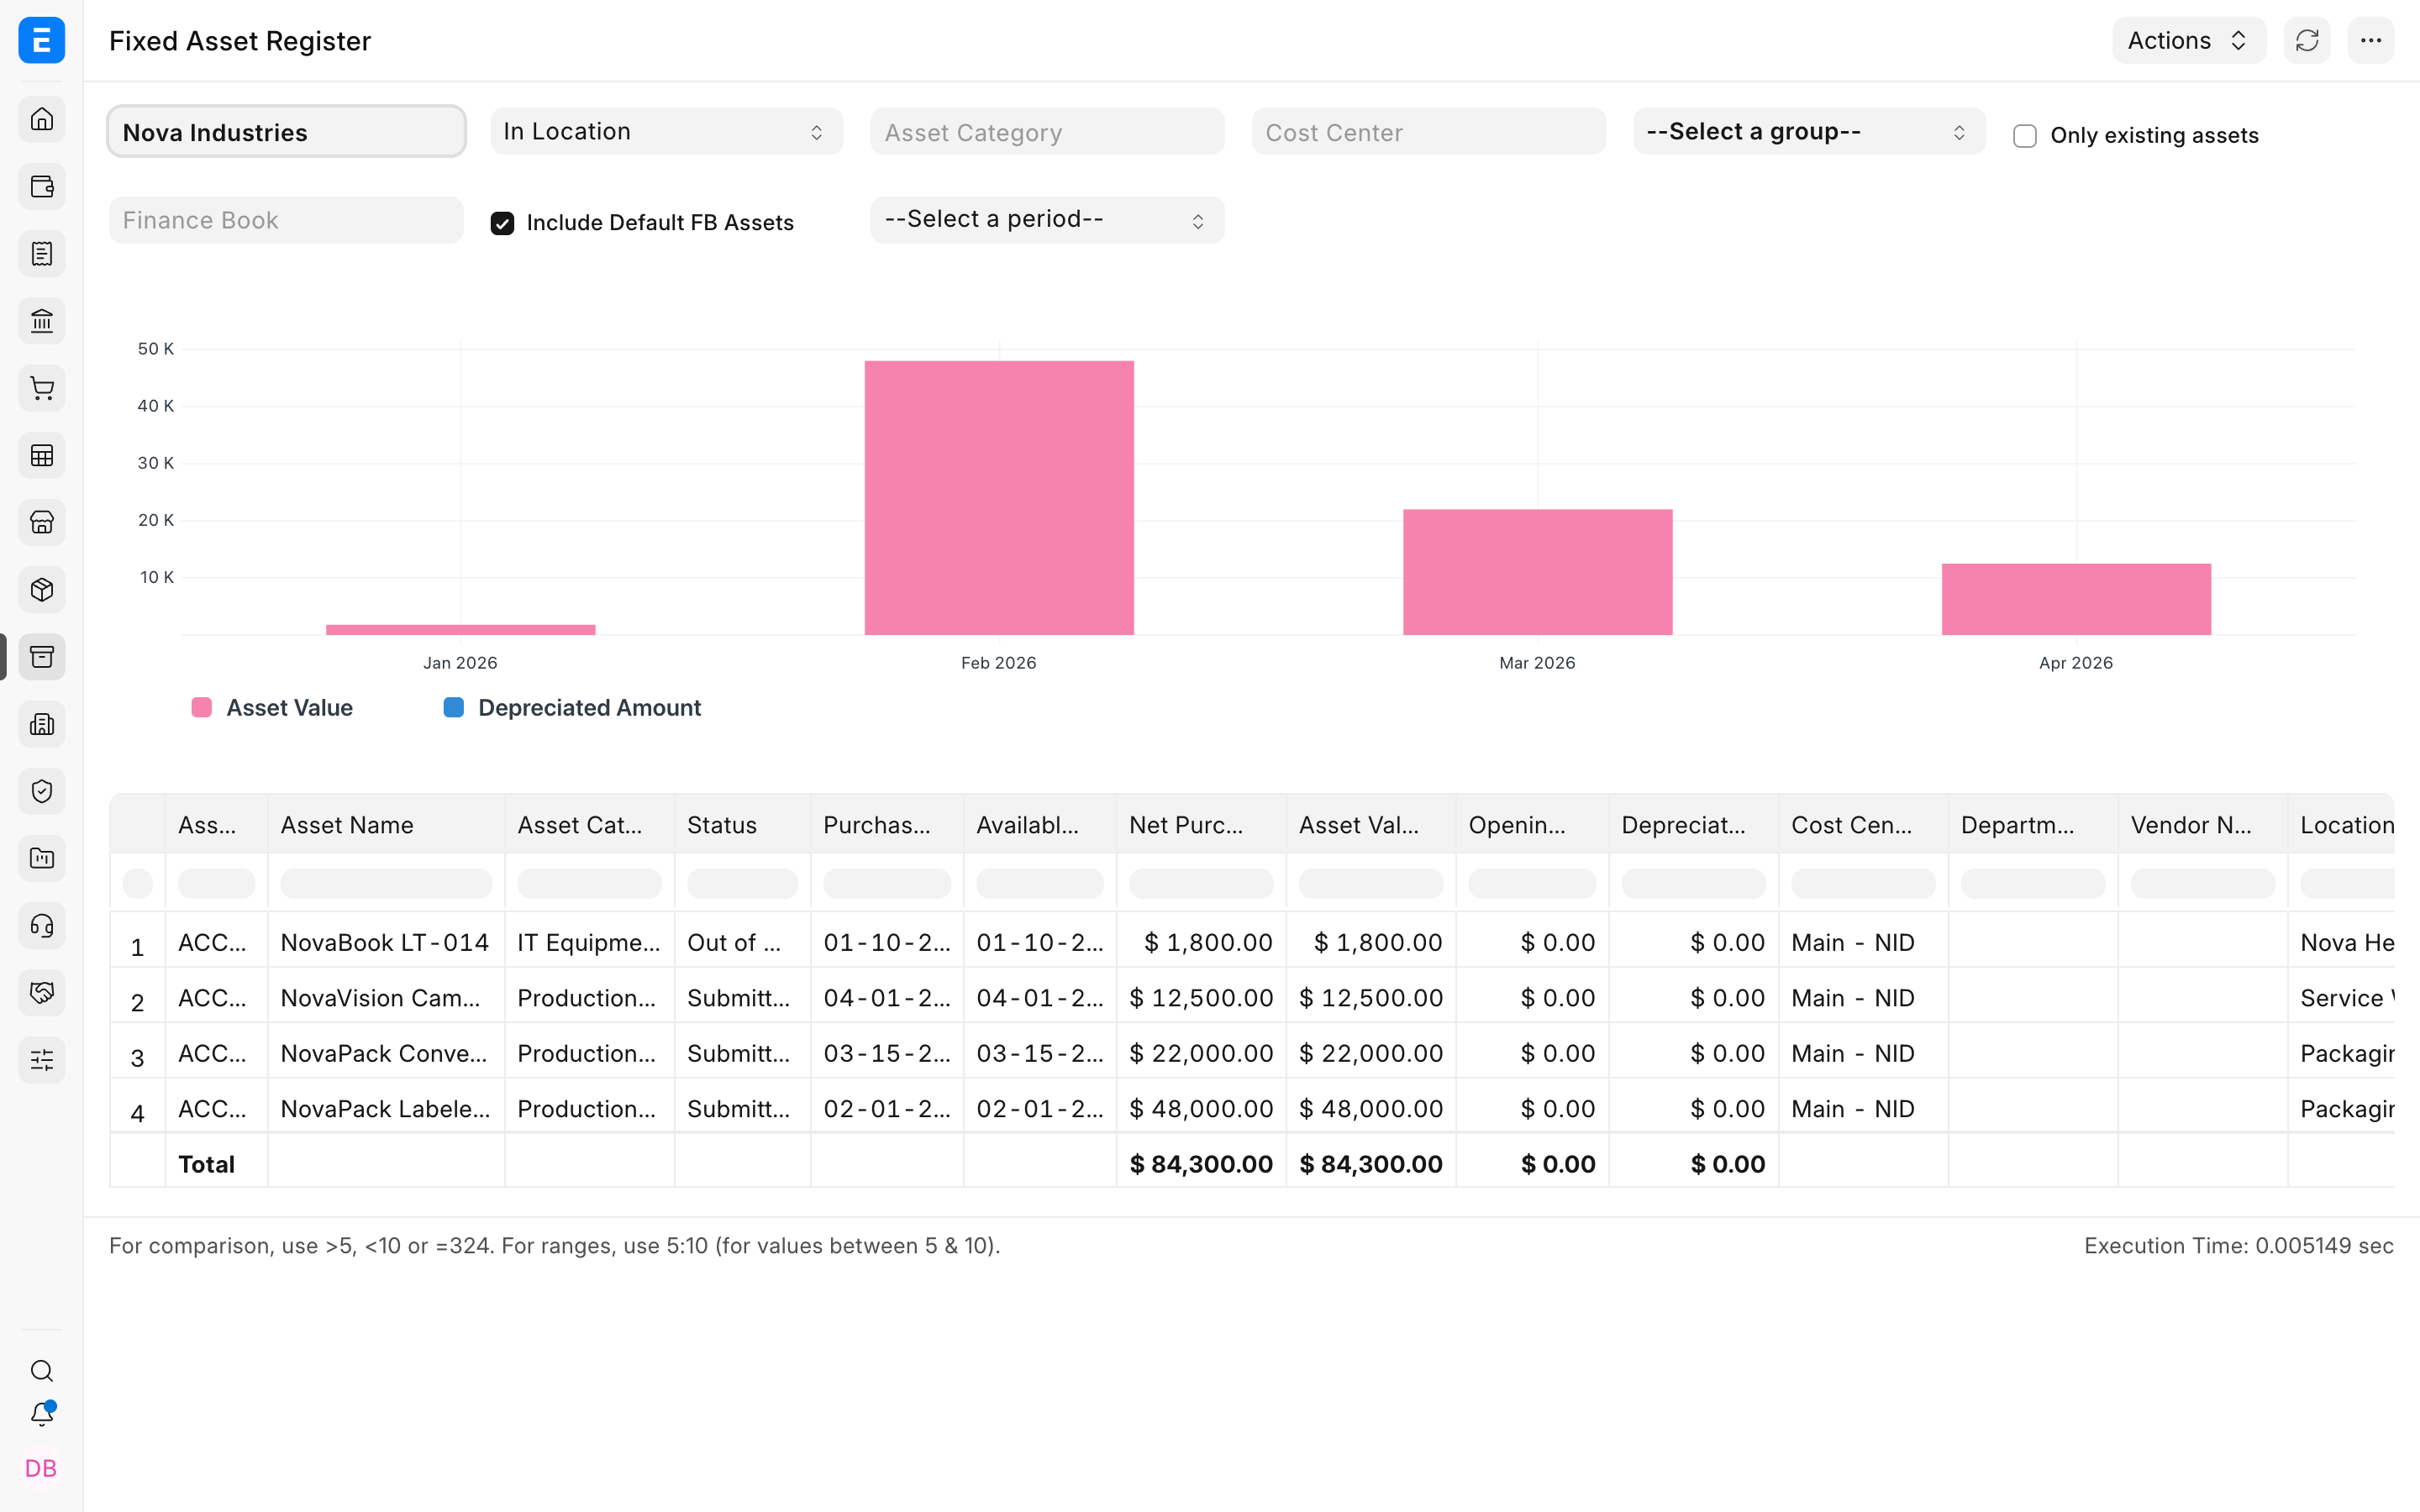
Use it for the controlled asset listing and location or custodian review. The chart gives a quick acquisition view while the rows contain the audit detail.
Asset Activity
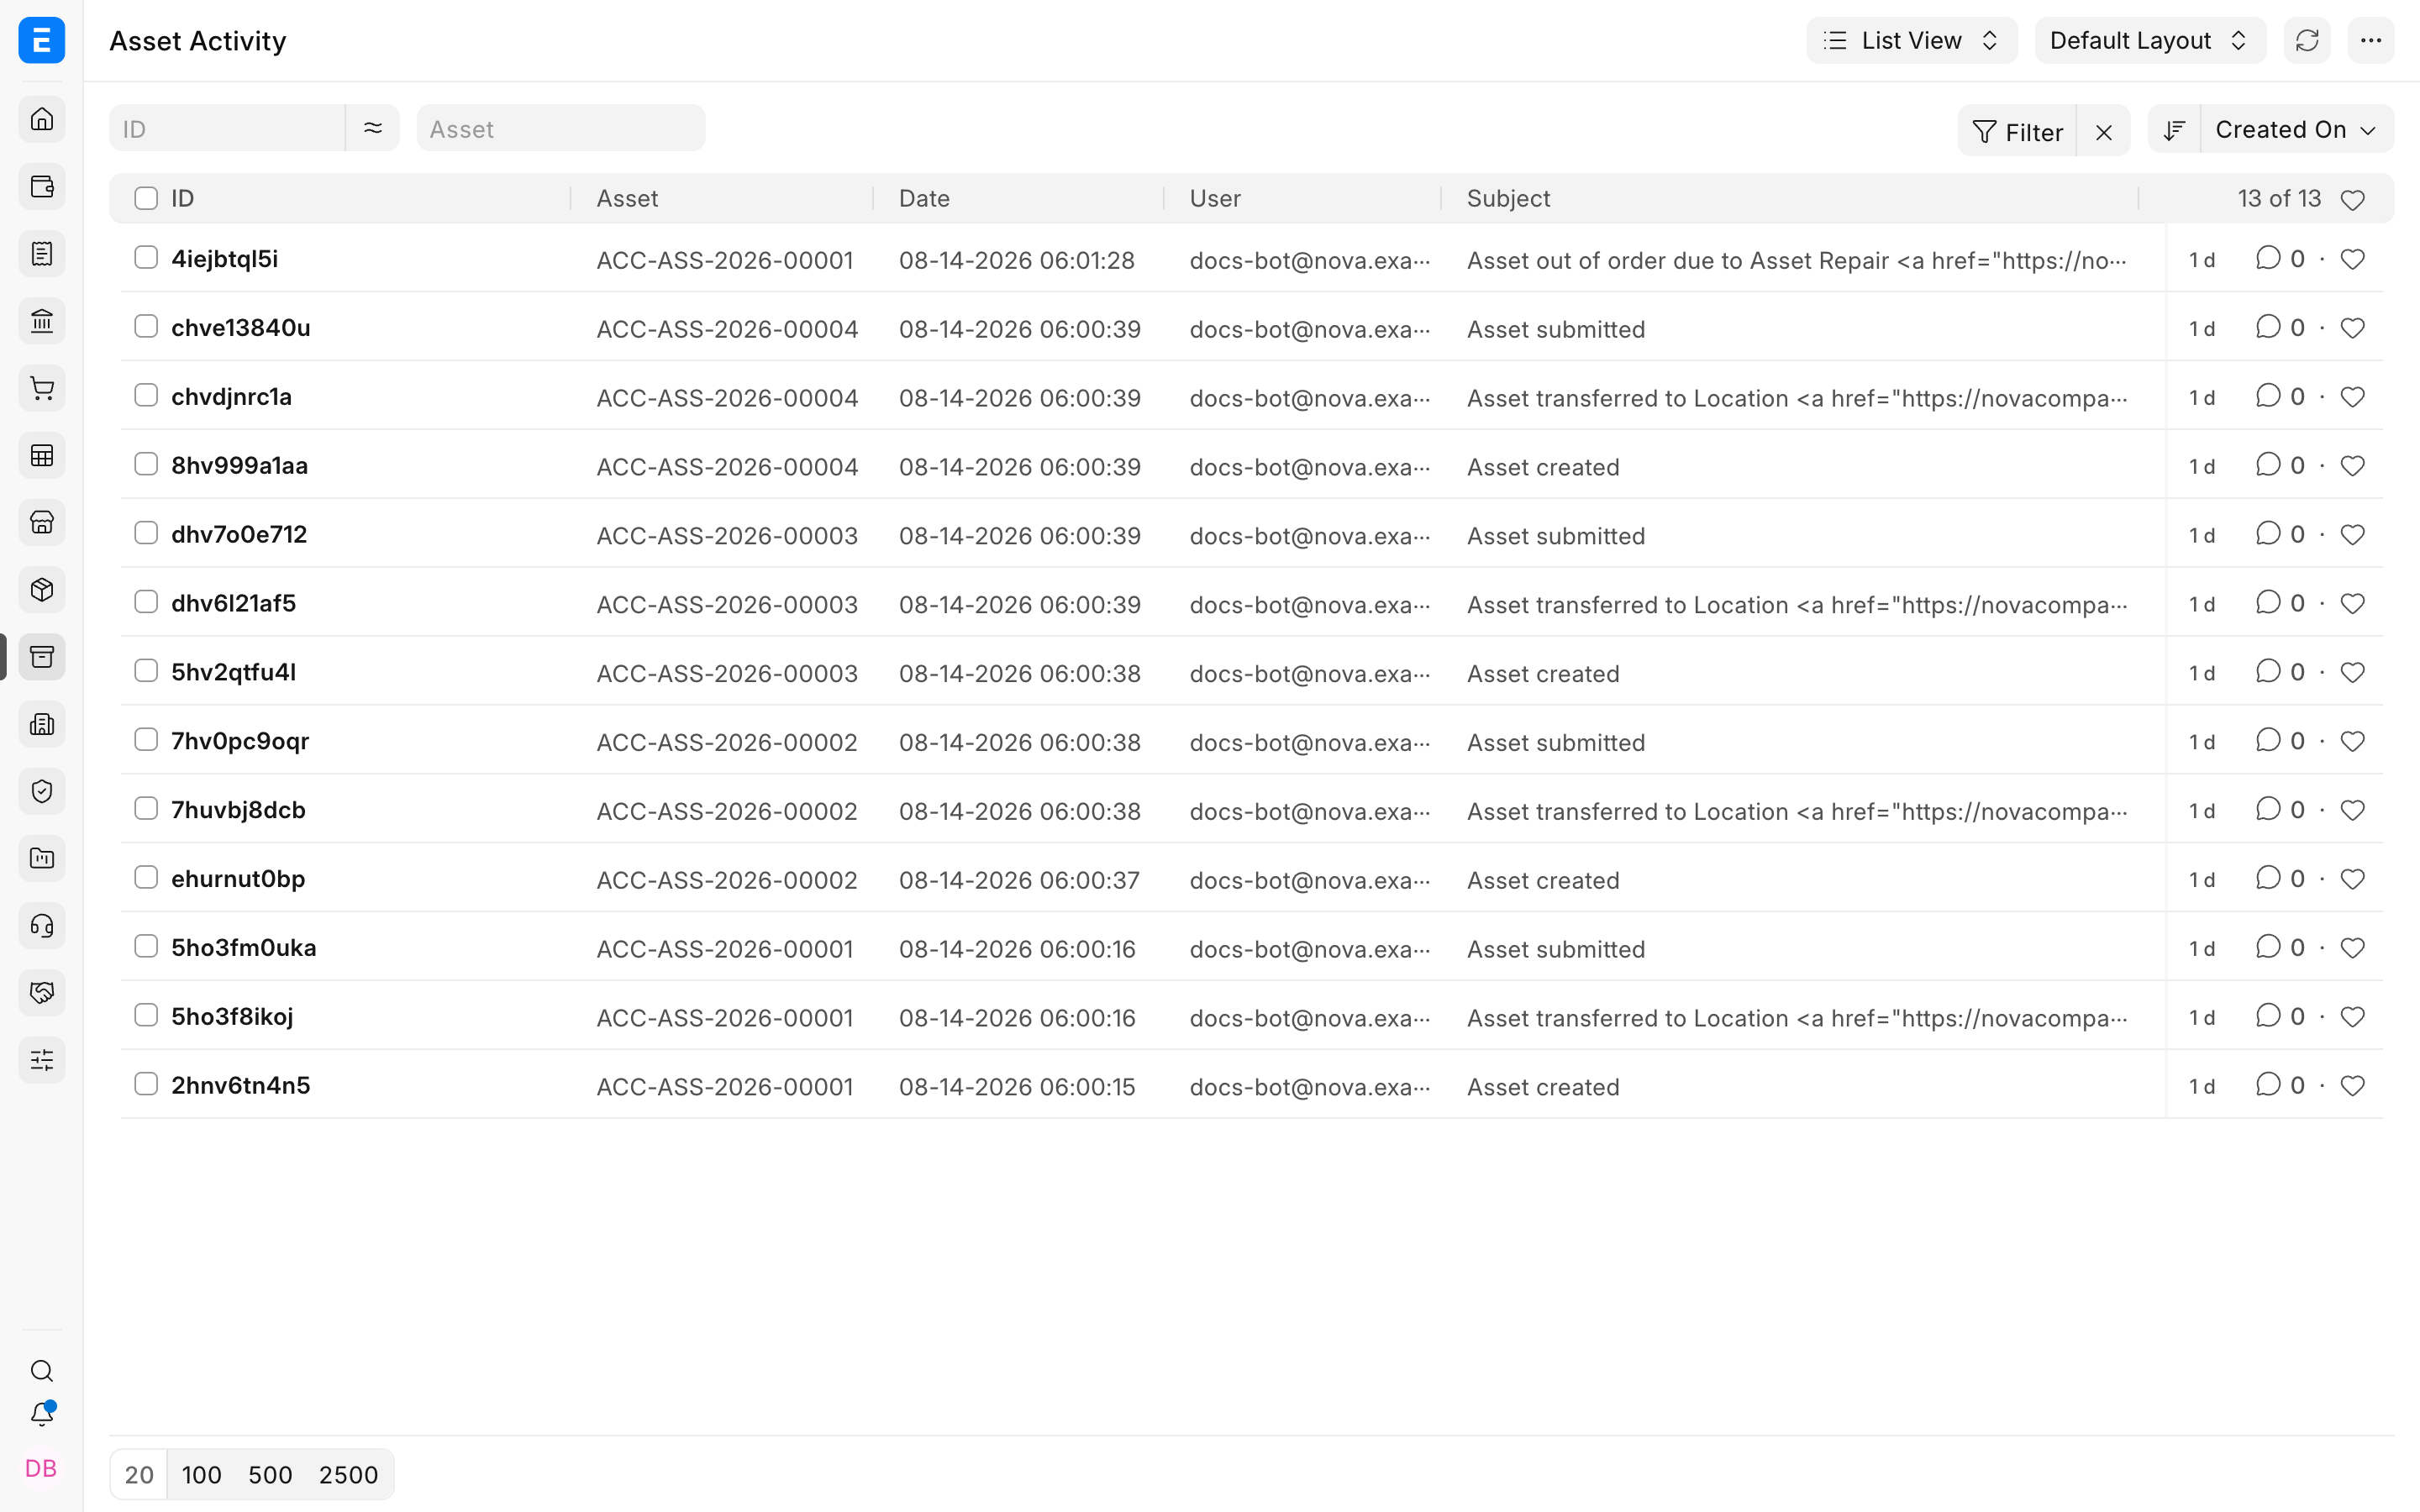
Use this report when the question is "what happened to this asset?" Filter to the asset or period, then open linked documents to verify the event.
The example below contains real lifecycle events for Nova's laptops and production equipment, including creation, location receipt, submission, and a repair event.
Read a report safely
- Select the company and Finance Book explicitly.
- Set a period that matches the reconciliation.
- Check whether the report includes default Finance Book assets.
- Wait for the rows and charts to finish loading.
- Drill into source documents for material or unexpected values.
- Export only after the filters and totals are verified.
Troubleshooting
The report is empty
Check company, date range, Asset status, Finance Book, and whether depreciation or lifecycle transactions exist in the period.
Two reports show different totals
Confirm they answer the same question and use identical company, date, Finance Book, and status filters.
A row shows zero depreciation
Open the Asset Depreciation Schedule and verify that entries have been posted for the selected period.
Frequently asked questions
Which report should I give an auditor?
The Fixed Asset Register is a common starting point, supported by depreciation and ledger reports plus source documents.
Where do I check a single Asset's full history?
Use Asset Activity, then open the linked Asset and transactions.
Can reports compare Finance Books?
Run or filter the report for each Finance Book so the basis remains explicit and totals are not mixed.
Why does the chart not match a filtered export?
Refresh after applying filters and ensure the chart and data table finished loading before export.