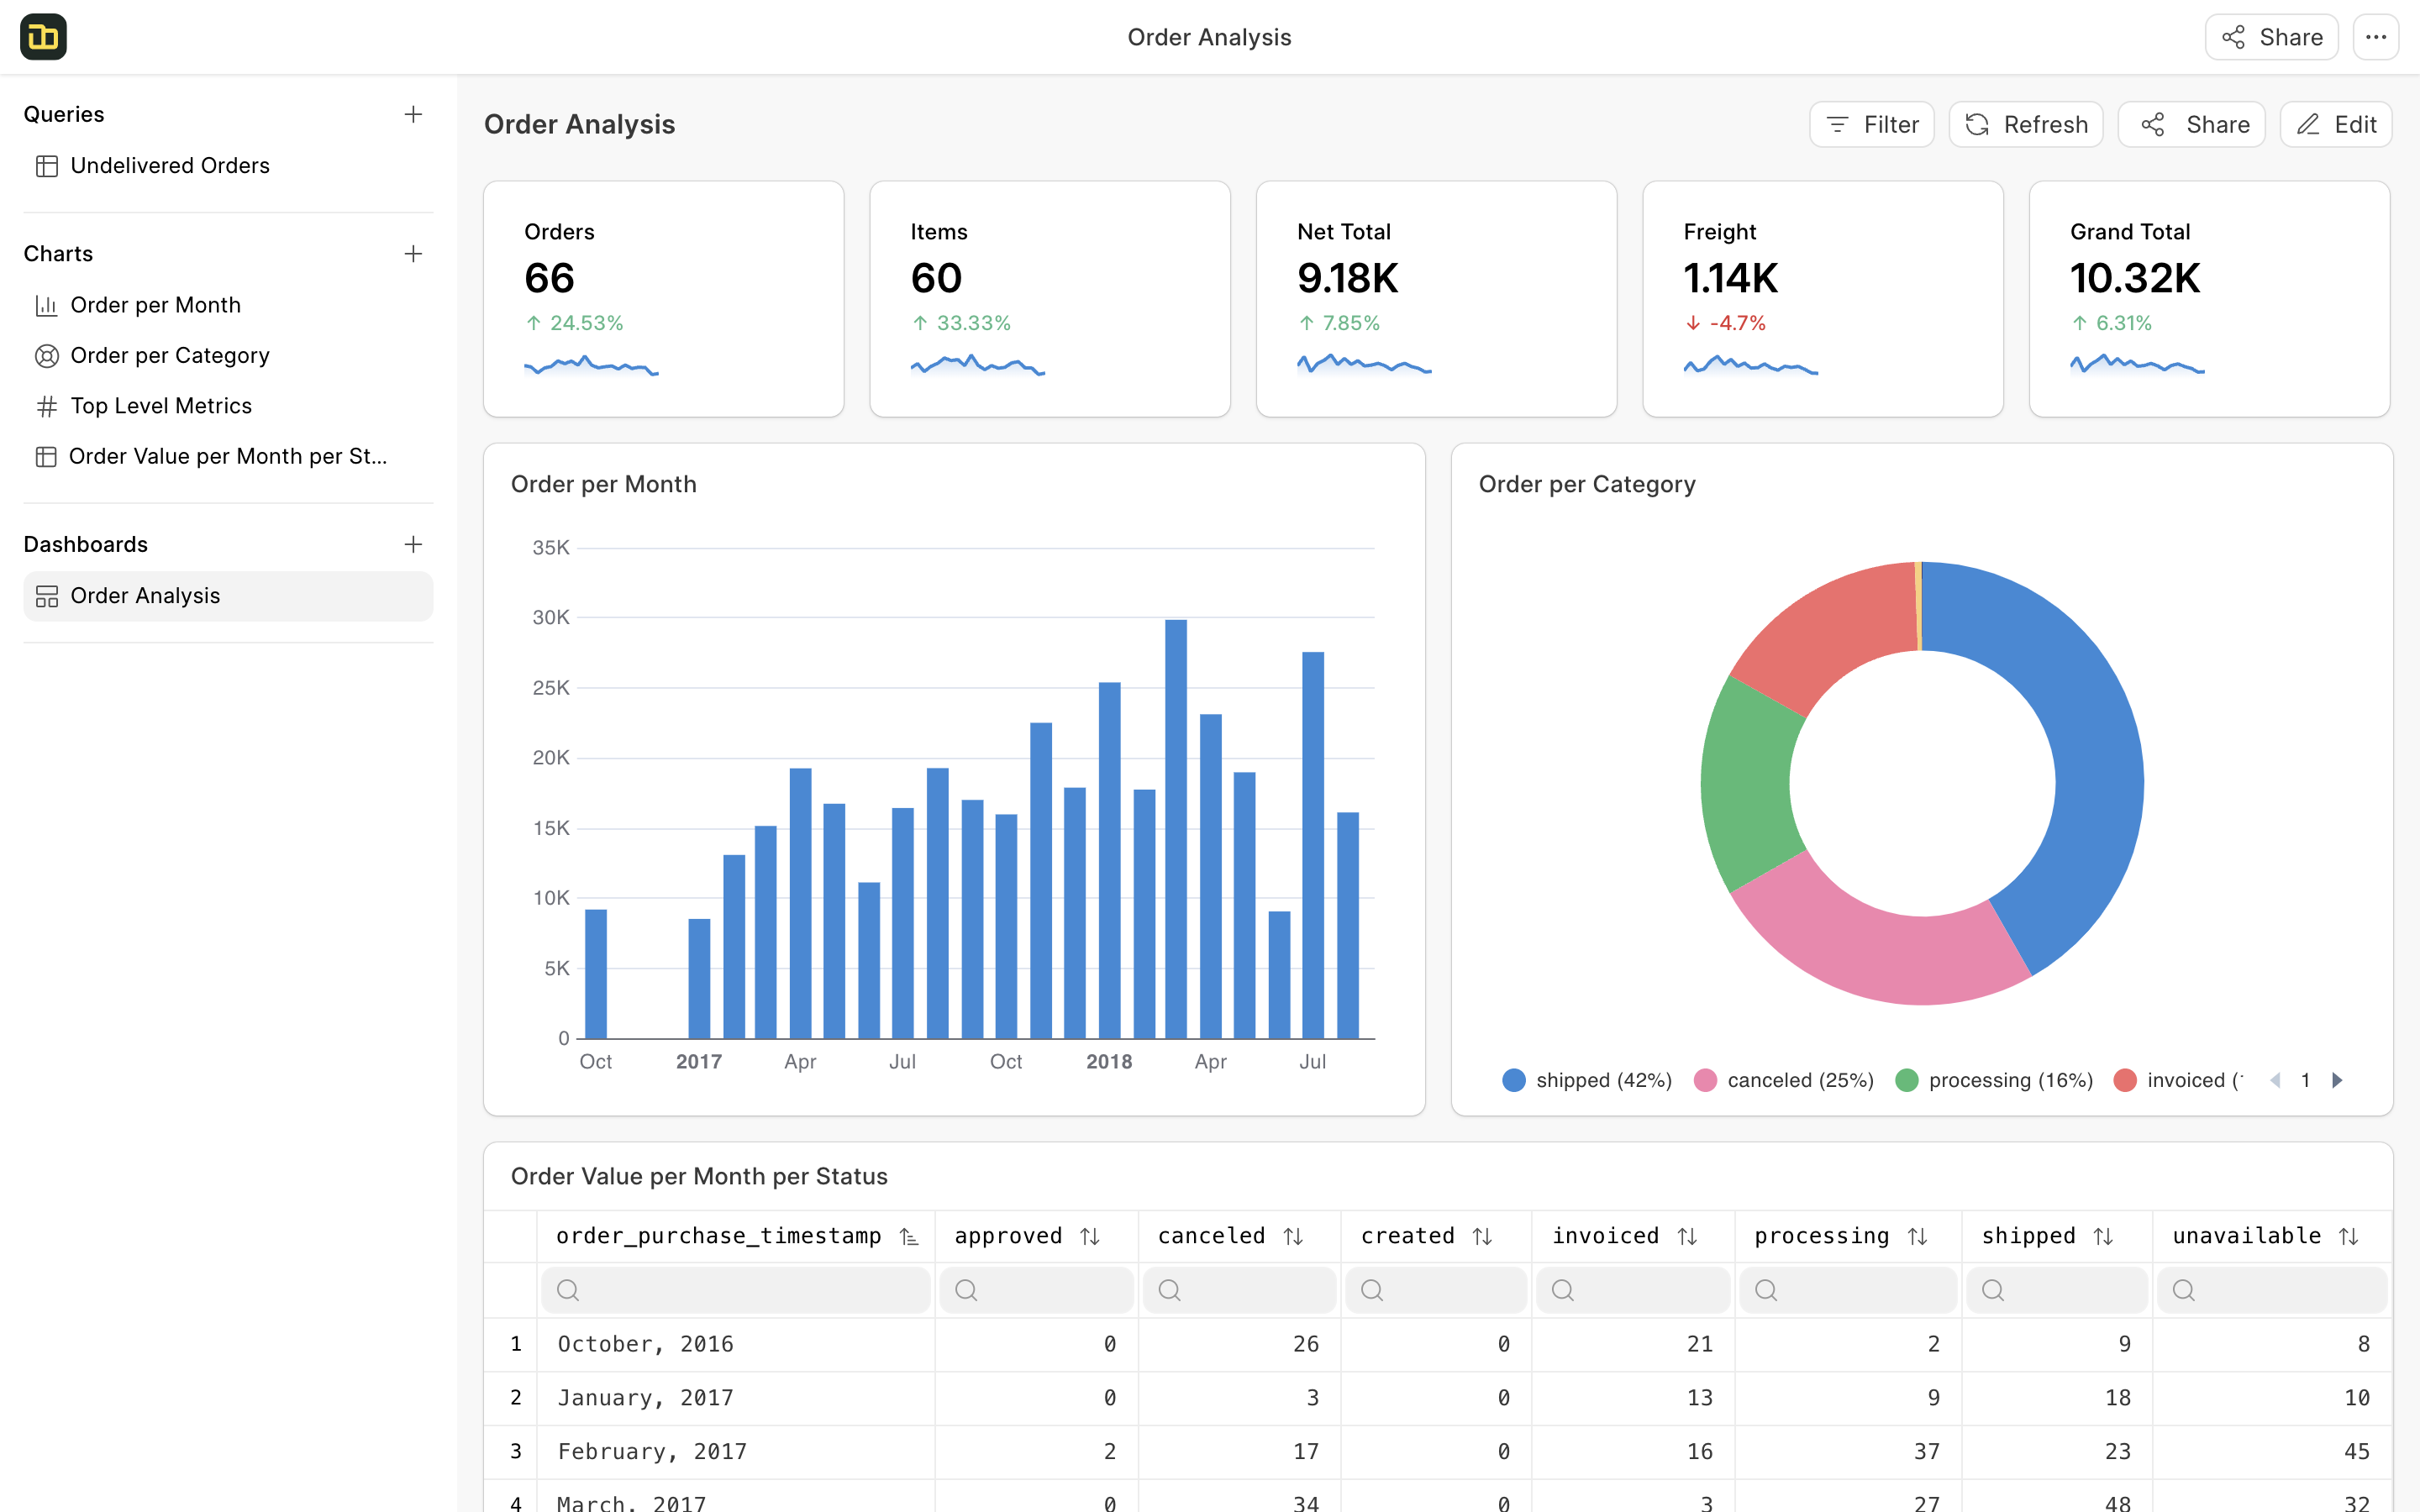
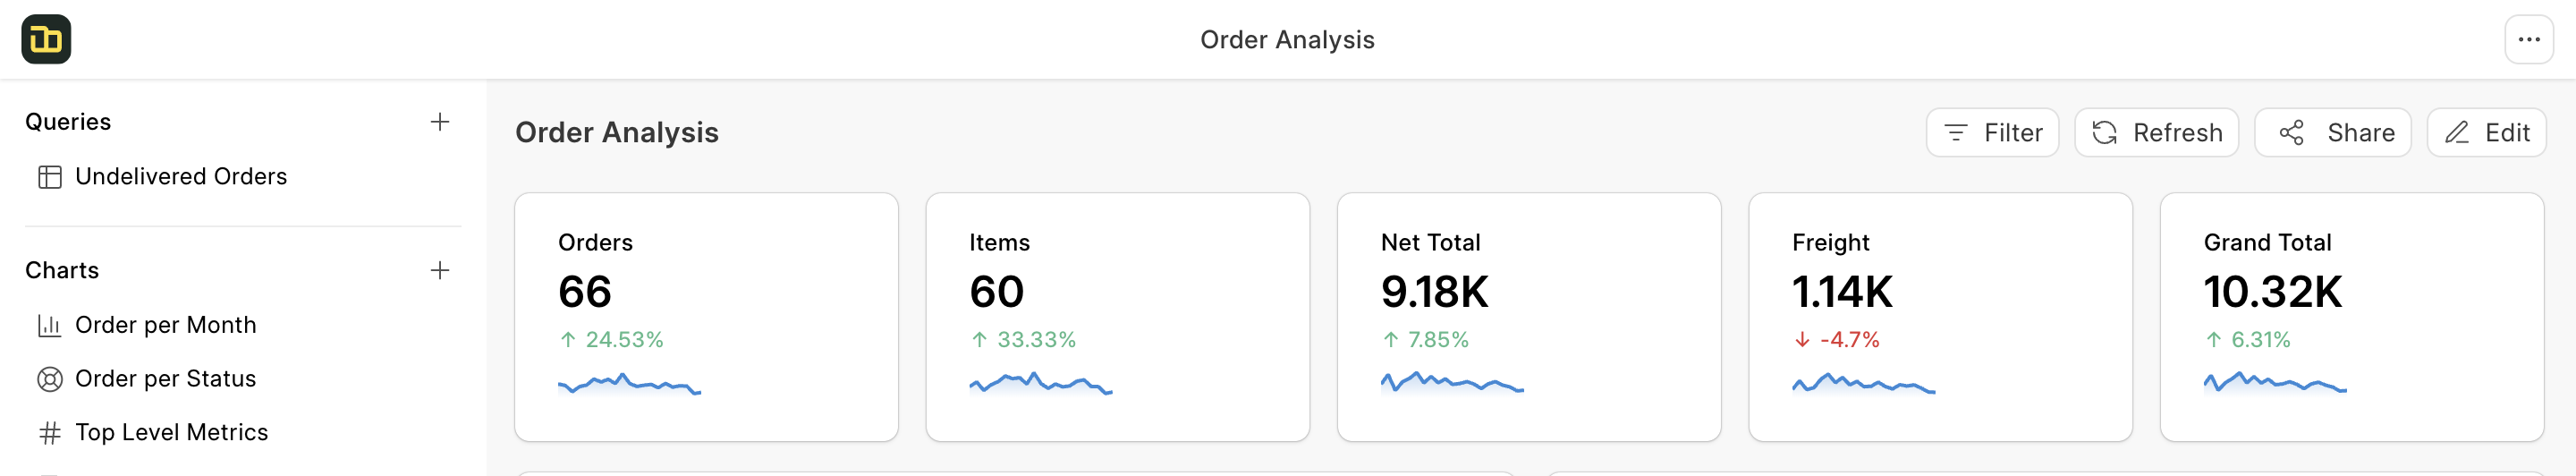
Dashboards
A dashboard displays multiple charts in a single view. Each workbook can contain multiple dashboards. Charts can be arranged in a grid layout and filtered to show specific data.
Creating a Dashboard
- Click the + button in the dashboard section
- In the dashboard builder, find your charts in the left panel
- Drag charts onto the dashboard area
- Arrange charts by dragging them to your preferred position
Dashboard Actions
Filter
Dashboard filters control what data appears in your charts. You can filter using:
- Any column from your queries
- Columns from linked queries
- Multiple filters at once
Understanding Query Filters
When you filter a dashboard:
- All charts using the filtered columns are affected
- Filters work on both main queries and linked queries
- Changes apply instantly to all relevant charts
Using Dependent Filters
To create filters that work together:
- Add your primary filter (e.g., Country)
- Select your filter values
- Add your secondary filter (e.g., City)
The secondary filter will only show values related to your primary filter's selection.
Share
Your dashboard can be:
- Shared via a public link
- Viewed without login
- Embedded in other websites
Frequently Asked Questions
How do I use dependent filters?
- Add your first filter (like State)
- Make your selection
- Add your second filter (like City)
The second filter will automatically show only relevant options. For example, selecting "California" as the state will show only California cities in the city filter.
Last updated 5 months ago