Server
When you run the bench start command during development, the log from each
process of the Procfile is logged in the terminal window.
▶ bench start
14:55:17 system | redis_cache.1 started (pid=4085)
14:55:17 system | redis_socketio.1 started (pid=4086)
14:55:17 system | redis_queue.1 started (pid=4088)
14:55:17 system | web.1 started (pid=4089)
14:55:17 system | socketio.1 started (pid=4090)
14:55:17 system | watch.1 started (pid=4094)
14:55:17 system | worker_short.1 started (pid=4096)
14:55:17 system | schedule.1 started (pid=4095)
14:55:17 redis_queue.1 | 4088:C 22 May 14:55:17.257 # oO0OoO0OoO0Oo Redis is starting oO0OoO0OoO0Oo
14:55:17 redis_queue.1 | 4088:C 22 May 14:55:17.264 # Redis version=4.0.11, bits=64, commit=00000000, modified=0, pid=4088, just started
14:55:17 redis_queue.1 | 4088:C 22 May 14:55:17.264 # Configuration loaded
14:55:17 redis_queue.1 | 4088:M 22 May 14:55:17.265 * Increased maximum number of open files to 10032 (it was originally set to 4864).
14:55:17 redis_cache.1 | 4085:C 22 May 14:55:17.262 # oO0OoO0OoO0Oo Redis is starting oO0OoO0OoO0Oo
14:55:17 redis_cache.1 | 4085:C 22 May 14:55:17.268 # Redis version=4.0.11, bits=64, commit=00000000, modified=0, pid=4085, just started
14:55:17 redis_cache.1 | 4085:C 22 May 14:55:17.268 # Configuration loaded
14:55:17 redis_cache.1 | 4085:M 22 May 14:55:17.269 * Increased maximum number of open files to 10032 (it was originally set to 4864).
14:55:17 redis_socketio.1 | 4086:C 22 May 14:55:17.262 # oO0OoO0OoO0Oo Redis is starting oO0OoO0OoO0Oo
14:55:17 redis_socketio.1 | 4086:C 22 May 14:55:17.270 # Redis version=4.0.11, bits=64, commit=00000000, modified=0, pid=4086, just started
14:55:17 redis_socketio.1 | 4086:C 22 May 14:55:17.270 # Configuration loaded
14:55:17 redis_socketio.1 | 4086:M 22 May 14:55:17.272 * Increased maximum number of open files to 10032 (it was originally set to 4864).
14:55:17 redis_queue.1 | 4088:M 22 May 14:55:17.285 * Running mode=standalone, port=11002.
14:55:17 redis_queue.1 | 4088:M 22 May 14:55:17.285 # Server initialized
14:55:17 redis_queue.1 | 4088:M 22 May 14:55:17.286 * Ready to accept connections
14:55:17 redis_cache.1 | 4085:M 22 May 14:55:17.287 * Running mode=standalone, port=13002.
14:55:17 redis_cache.1 | 4085:M 22 May 14:55:17.292 # Server initialized
14:55:17 redis_cache.1 | 4085:M 22 May 14:55:17.292 * Ready to accept connections
14:55:17 redis_socketio.1 | 4086:M 22 May 14:55:17.294 * Running mode=standalone, port=12002.
14:55:17 redis_socketio.1 | 4086:M 22 May 14:55:17.294 # Server initialized
14:55:17 redis_socketio.1 | 4086:M 22 May 14:55:17.295 * Ready to accept connections
14:55:17 system | worker_long.1 started (pid=4098)
14:55:17 system | worker_default.1 started (pid=4100)
14:55:18 socketio.1 | listening on *: 9002
14:55:20 socketio.1 | { Error: connect ECONNREFUSED 0.0.0.0:8002
14:55:20 socketio.1 | at TCPConnectWrap.afterConnect [as oncomplete] (net.js:1191:14)
14:55:20 socketio.1 | errno: 'ECONNREFUSED',
14:55:20 socketio.1 | code: 'ECONNREFUSED',
14:55:20 socketio.1 | syscall: 'connect',
14:55:20 socketio.1 | address: '0.0.0.0',
14:55:20 socketio.1 | port: 8002,
14:55:20 socketio.1 | response: undefined }
14:55:24 web.1 | * Running on http://0.0.0.0:8002/ (Press CTRL+C to quit)
14:55:24 web.1 | * Restarting with fsevents reloader
14:55:24 watch.1 | yarn run v1.10.1
14:55:24 watch.1 | $ node rollup/watch.js
14:55:25 web.1 | * Debugger is active!
14:55:25 web.1 | * Debugger PIN: 321-355-865
14:55:26 watch.1 |
14:55:26 watch.1 | Rollup Watcher Started
14:55:26 watch.1 |
14:55:26 watch.1 | Watching...
14:55:26 watch.1 | Rebuilding frappe-web.css
14:55:27 watch.1 | Rebuilding frappe-web-b4.css
14:55:27 watch.1 | Rebuilding chat.js
14:55:28 web.1 |
14:55:28 web.1 | test print
When you write any print statements in your python code, it will show up in the
web: process log if it is a request/response, or in one of worker_ processes
if the code runs in a background job.
If you are a VSCode user, you can debug right in your editor by setting breakpoints in your code. Follow these steps to set it up.
Logging
In case you're running production, you'd need logs all the more to keep track of as much information about your Frappe environment.
Out of the box, logs are stored under the ./logs folder in your bench. From Frappe Version 13, logs are available at site level too, under ./sites/{site}/logs.
These site logs are created by the Frappe Application, while many of the bench level log files are generated by the processes that support your Frappe environment. Checkout Procfile or supervisor.conf in your bench for more information.
Learn more about Frappe Logs here and the Frappe Logging API from here.
Console
To play with Python API, bench provides an iPython shell. After you run the following command, it will import frappe, initialize it and also connect to database.
▶ bench --site [sitename] console

In [1]: frappe.get_doc('Task', 'TASK00004')
Out[1]:
Client
Client side debugging is as simple as adding a debugger statement in your JS
file. You must open your DevTools in your browser for it to pause on the statement.
frappe.db.get_value('Task', 'TASK00004', 'status')
 .then(values => {
 debugger
 console.log(values);
 })
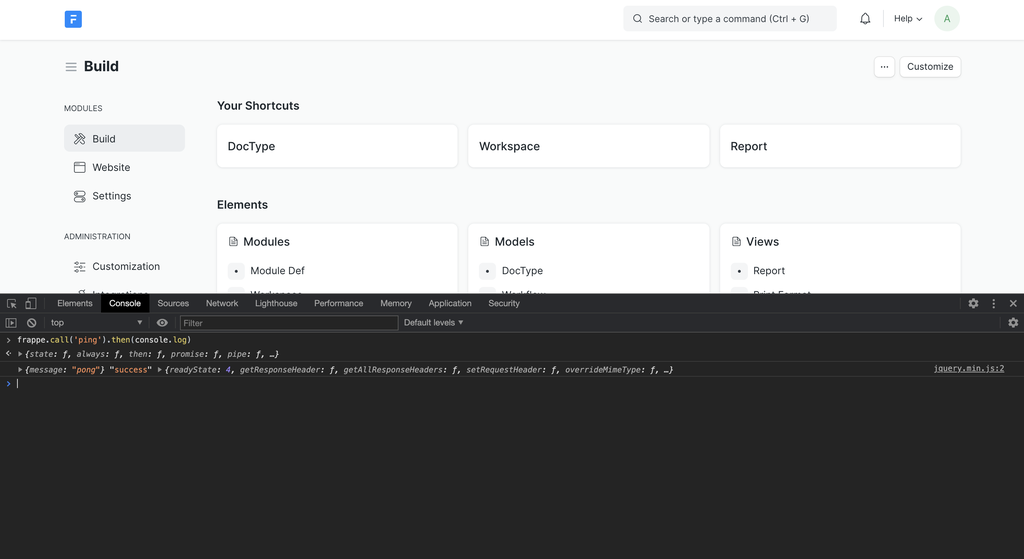
Console
To play with Client API, you can open your browser's console and use the
globally available frappe object to explore and run methods and access
properties.
 Browser Console
Learn more about the Client API here