Profiling and Monitoring
Recorder - SQL profiler
Frappe Recorder is a profiling tool built into the Frappe framework designed to capture all requests, SQL queries executed along with stack traces.
Example use case: You've noticed that a certain doctype is taking too much time to save and you believe that SQL queries might be a bottleneck. In such a case starting recorder and then submitting your document will give you complete capture of all the queries that took place.
- Open Recorder from Awesomebar and click on "Start recording".
- Perform the actions you want to profile (preferably in another tab.)
- Once you've captured enough information, go to the recorder again and stop recording.
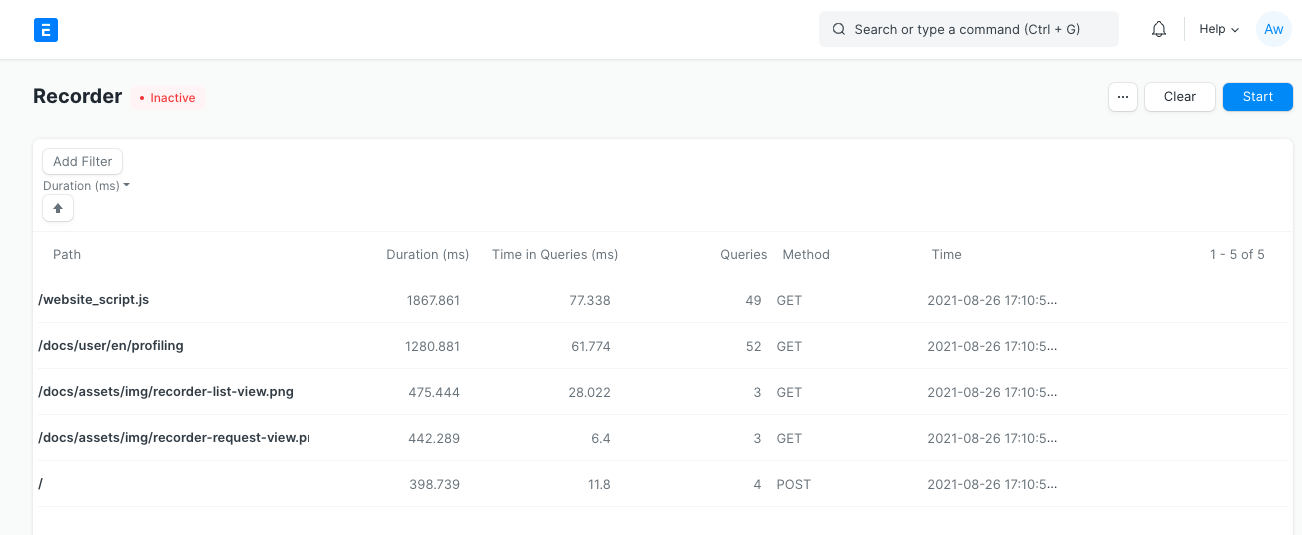
You will now see a list of all the requests that were made. You can sort them by various columns to identify problematic requests.

Click on a row to open the request for extra information. Following information is available in capture:
- path - requested path e.g.
/app - cmd - dotted path to the method
- time - time at which request was created
- duration - duration for completing the request (see implementation note below)
- number of queries - Number of SQL queries executed for fulfilling the request.
- Time in queries - Time taken in SQL queries.
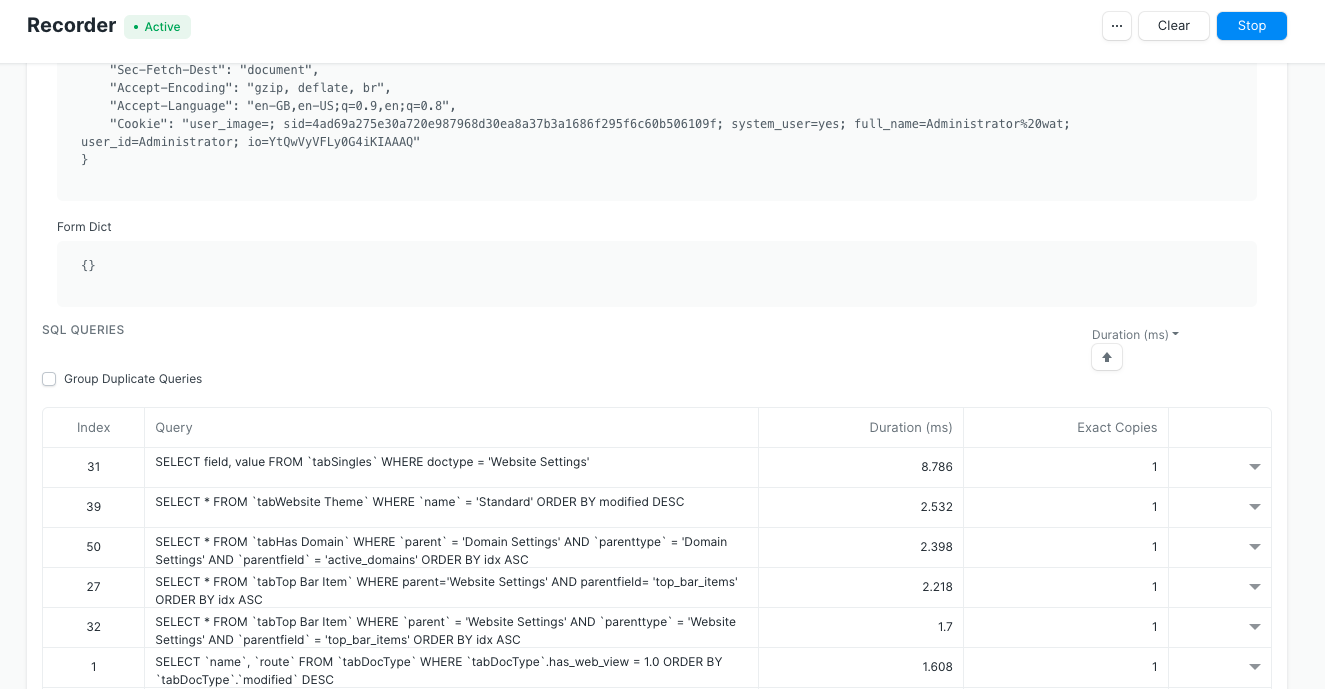
- Request headers - HTTP headers received with the request.
- Form Dict - form data received with the request.
- SQL queries - table of all SQL queries that ran.

SQL Queries table can be sorted and grouped for duplicates to find the relevant queries. To know more about a particular query click on row to expand additional information. This includes the duration of the query, stack trace and SQL's EXPLAIN output for that query.
Implementation note: Recorder adds sizable overhead for capturing the details, hence overall duration is not representative of real-world performance. Query time however is very close to real-world performance.
Exporting Frappe Recorder captures
You can export recorder captures and import them on another site for further analysis.
- Go to recorder page. Once you've recorded click on Menu (three dots) > Export Data.
- This will download a JSON file containing captured data. To view this on another site drag and drop the JSON file on the recorder page.
Profiling functions using bench
Bench's execute command runs a dotted path to method and it also supports
profiling.
▶ bench --site [sitename] --profile execute erpnext.projects.doctype.task.task.set_tasks_as_overdue
You should be able to run most commands you can run via console with execute now, including db methods.
▶ bench --site [sitename] execute frappe.db.get_database_size
6784
Frappe Monitor
Monitor logs request and job metadata. To enable this feature set "monitor": 1 in your site config.
Collected data is buffered in redis cache and periodically moved to monitor.json.log file in logs directory with a scheduled job frappe.monitor.flush.
{
 "duration": 807142,
 "request": {
 "ip": "127.0.0.1",
 "method": "GET",
 "path": "/api/method/frappe.realtime.get_user_info",
 "response_length": 9687,
 "status_code": 500
 },
 "site": "frappe.local",
 "timestamp": "2020-03-05 09:37:17.397884",
 "transaction_type": "request",
 "uuid": "83be6a4c-27a1-497a-9ce6-c815bca4e420"
}
{
 "duration": 1364,
 "job": {
 "method": "frappe.ping",
 "scheduled": false,
 "wait": 90204
 },
 "site": "frappe.local",
 "timestamp": "2020-03-05 09:37:40.124682",
 "transaction_type": "job",
 "uuid": "8225ab76-8bee-462c-b9fc-a556406b1ee7"
}