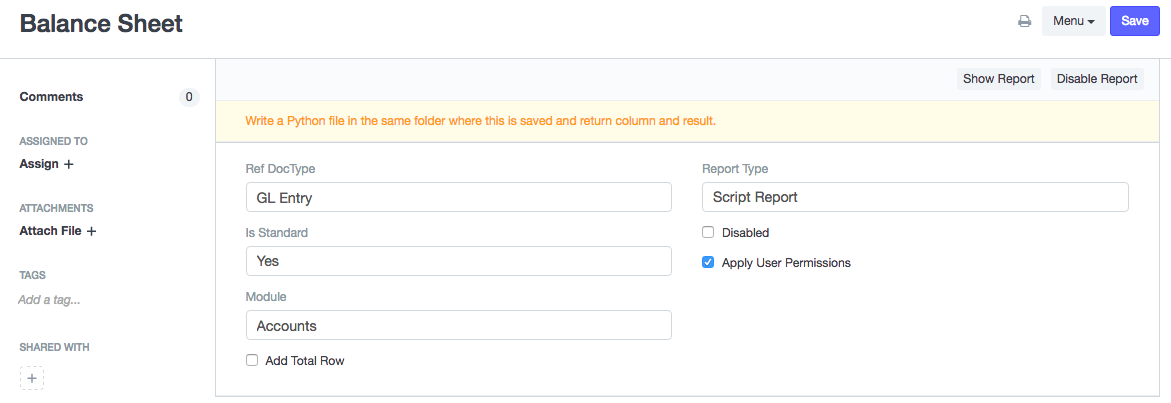
You can create tabulated reports using server side scripts by creating a new Report.
Note: You will need Administrator Permissions for this.
Since these reports give you unrestricted access via Python scripts, they can only be created by Administrators. The script part of the report becomes a part of the repository of the application. If you have not created an app, read this.
Note: You must be in Developer Mode to do this
1. Create a new Report

- Set Report Type as "Script Report"
- Set "Is Standard" as "Yes"
- Select the Module in which you want to add this report
- In the module folder (for example if it is Accounts in ERPnext the folder will be
erpnext/accounts/report/[report-name]) you will see that templates for the report files will be created. - In the
.jsfile, you can set filters for the reports - In the
.pyfile, you can write the script that will generate the report
2. Add Filters
You can add filters in the .js. See an example below:
frappe.query_reports["Accounts Receivable"] = { "filters": [ { "fieldname":"company", "label": __("Company"), "fieldtype": "Link", "options": "Company", "default": frappe.defaults.get_user_default("company") }, ] }
- These properties are the same as you would set in a DocField in a DocType
3. Add the Script
In the .py file you can add the script for generating the report.
- In the
executemethod, two listscolumnsanddataare returned - Columns must be a list of dictionaries containing fields like fieldname, label, fieldtype, options,width. For example:
columns = [{
 "fieldname": "account",
 "label": _("Account"),
 "fieldtype": "Link",
 "options": "Account",
 "width": 300
},
{
 "fieldname": "currency",
 "label": _("Currency"),
 "fieldtype": "Link",
 "options": "Currency",
}]
- You can use all server side modules to build your report.
- For example see existing reports. (Balance Sheet)
4. Add link for your report on the module page

- In the module folder (for example if it is Accounts in ERPNext the folder will be
erpnext/config/accounts.py) you will see labels and items for various sections. The new report can be added in the item list as show in the example:
def get_data():
 return [{
 "label": _("Accounting Statements"),
 "items": [{
 "type": "report",
 "name": "Balance Sheet",
 "doctype": "GL Entry",
 "is_query_report": True
 }]
 }]
Additional Reference: https://discuss.erpnext.com/t/tutorial-script-report-chart/79873