
Common Operations
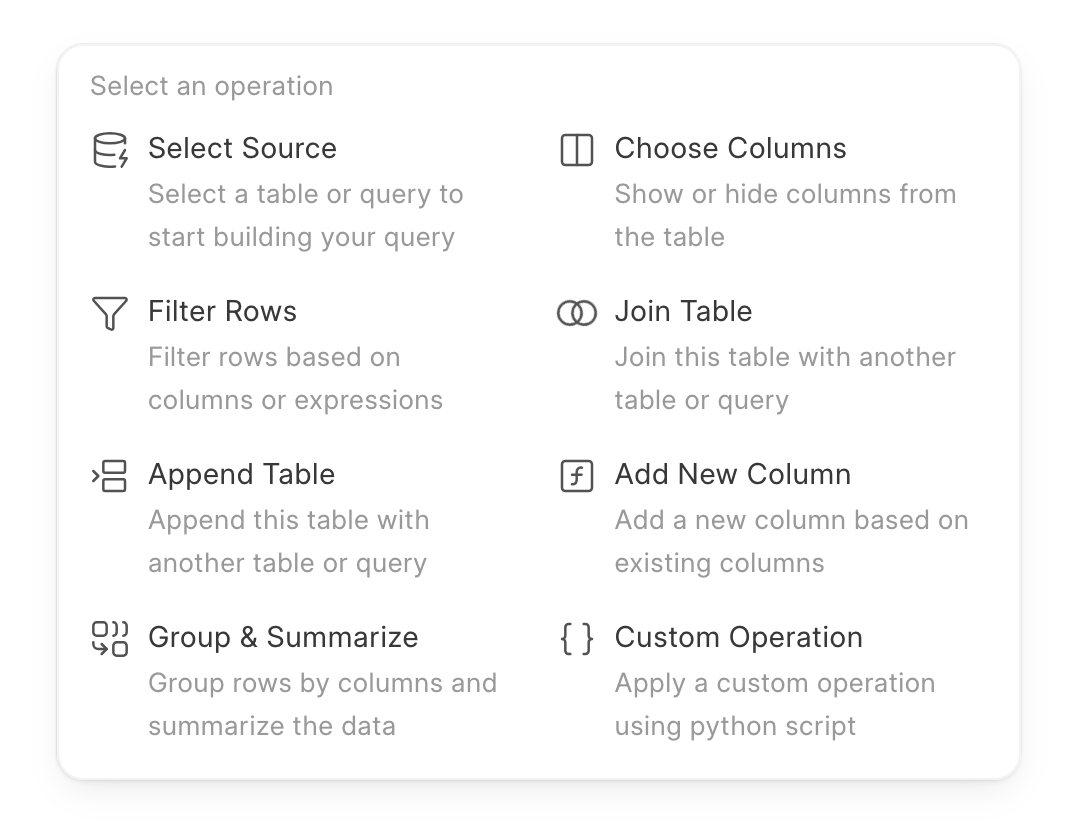
Choose Columns
What it does: Select which columns you want to include in your results. This helps focus your analysis on the data that matters.
When to use it
- You only need specific columns from a table
- You want to hide unnecessary columns to simplify your results
- You need to improve query performance by reducing data volume
How it works
From your available columns, select only those you want to see in your results. All other columns will be hidden.
Example
From a Customer table with 20 columns, select only "Customer Name", "Email", "Region", and "Total Orders" for a customer contact list.
Tips
- Use this operation early in your query to improve performance
- Fewer columns means faster queries
- You can add columns back later if needed
Filter Rows
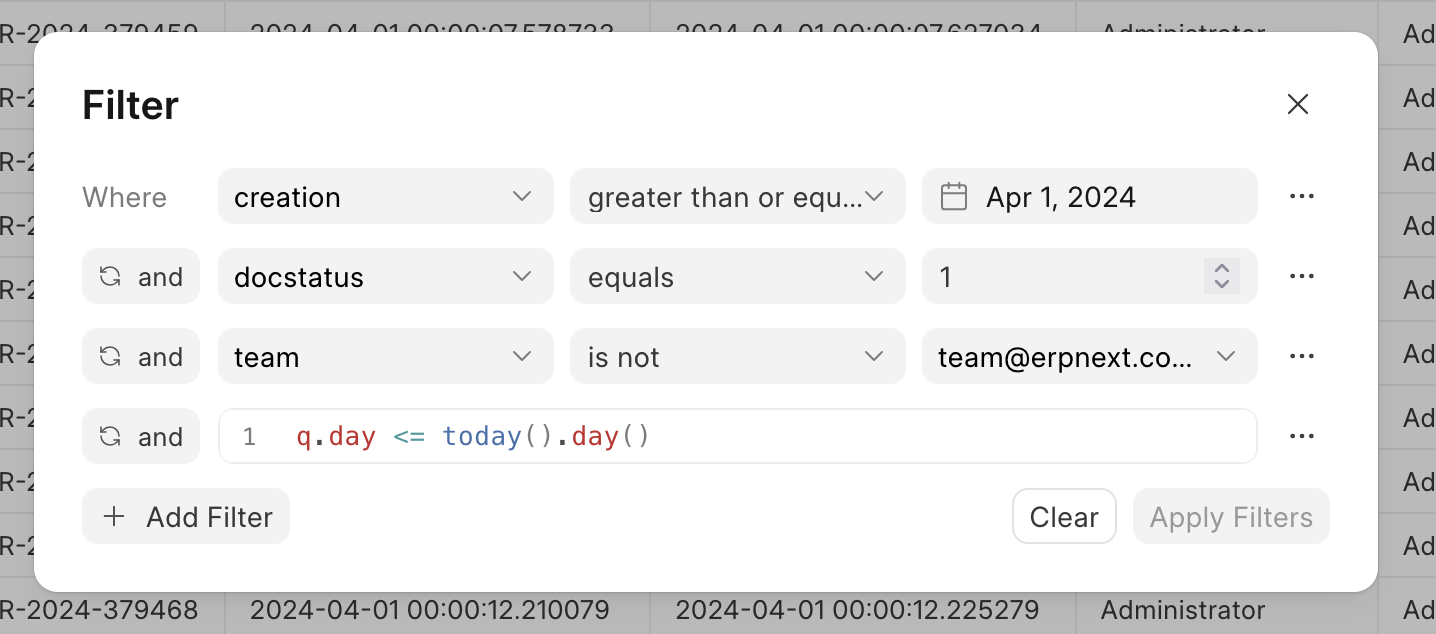
What it does: Show only the rows that match specific conditions. This helps you focus on relevant data.
When to use it:
- You want to analyze a specific time period
- You need data for a particular region or category
- You want to exclude certain values (like cancelled orders)
- You need to remove incomplete or invalid data
Available filter types
Comparison Filters
- Equals: Exact match
- Does not equal: Exclude specific values
- Greater than / Less than: For numbers and dates
- Greater than or equal to / Less than or equal to: Include boundary values
List Filters
- In: Match any value in a list (e.g., "New York", "Los Angeles", "Chicago")
- Not in: Exclude values in a list
Text Filters
- Contains: Find text anywhere in the column
- Does not contain: Exclude text
- Starts with: Match beginning of text
- Ends with: Match end of text
Special Filters
- Is set: Has a value (not empty)
- Is not set: Is empty or null
- Between: Value falls within a range
- Within: For relative date ranges (last 7 days, last month, etc.)
How it works You can combine multiple filters using:
- And: All conditions must be true
- Or: Any condition can be true
Examples
- Show orders from the last 30 days
- Display sales from "North" and "South" regions only
- Exclude cancelled orders
- Show customers with email addresses
Tips
- Apply filters early in your query for better performance
- Use "within" for dynamic date filtering (always shows last 7 days, etc.)
- Combine multiple filters to create precise conditions
Join Table
What it does: Combine data from two tables based on matching values in specific columns. This lets you bring related information together.
When to use it
- You need information from multiple tables
- You want to enrich your data with additional details
- You need to combine related datasets
Join types explained
Inner Join
- Shows only rows that have matches in both tables
- Use when you only want complete data
- Example: Show orders with customer details (only for orders that have a customer)
Left Join
- Shows all rows from your current table, plus matching rows from the joined table
- Use when you want to keep all your original data
- Example: Show all customers, including those who haven't placed orders yet
Right Join
- Shows all rows from the joined table, plus matching rows from your current table
- Less commonly used than Left Join
- Example: Show all products, including those that haven't been ordered
Full Join
- Shows all rows from both tables, whether they match or not
- Use when you need comprehensive data from both sides
- Example: Show all customers and all orders, even if some don't match
How it works
- Select the table you want to join with
- Choose the join type
- Specify which columns should match between the tables
- Select which columns from the joined table you want to include
Example
Join your "Orders" table with a "Customers" table using "Customer ID" to show customer names and contact information alongside order details.
Tips
- Most common join type is Left Join
- Join columns should contain matching values (like IDs)
- Select only the columns you need from the joined table
- If column names conflict, they will be automatically renamed
Append Table
What it does: Stack rows from another table below your current data. This combines datasets vertically.
When to use it
- You want to combine data from multiple time periods
- You need to merge data from different regions or locations
- You have similar data in separate tables that should be analyzed together
How it works
- Select the table to append
- Choose whether to remove duplicate rows
- Only columns that exist in both tables will be included
Options
- Include duplicates: Keep all rows, even if they're identical
- Remove duplicates: Show each unique row only once
Example: Combine "Q1 Sales" and "Q2 Sales" tables to analyze sales for the first half of the year.
Tips
- Both tables must have at least one column with the same name
- Only matching columns appear in the results
- Column types are automatically aligned
- Use "Remove duplicates" if you think there might be overlapping data
Add New Column
What it does: Create a new calculated column based on your existing columns using formulas or expressions.
When to use it
- You need to perform calculations on your data
- You want to create derived metrics
- You need to combine information from multiple columns
Common calculations
- Math operations: Add, subtract, multiply, divide
- Percentages: (part / total) * 100
- Profit calculations: revenue - cost
- Text combinations: Combine first and last names
- Conditional logic: Different values based on conditions
How it works
- Give your new column a name
- Choose the data type (Number, Text, Date, etc.)
- Enter your formula using existing column names
Examples
- Calculate profit: revenue - cost
- Find profit margin percentage: (profit / revenue) * 100
- Calculate order total: quantity * unit_price
- Combine text: first_name + " " + last_name
Tips
- Use clear, descriptive names for your calculated columns
- Make sure columns are the correct data type before calculating
- Test your formulas with a small sample first
- You can reference columns by their names in your formulas
Group & Summarize
What it does: Group your data by categories and calculate summary statistics like totals, averages, and counts.
When to use it
- You want to see totals by category (sales by region, orders by product)
- You need to calculate averages or other statistics
- You want to analyze trends over time
- You need to create aggregated reports
Summary functions
Sum: Add up all values
- Example: Total sales, total quantity
Count: Count the number of rows
- Example: Number of orders, number of customers
Count Distinct: Count unique values only
- Example: Number of unique customers, number of different products
Average: Calculate the mean value
- Example: Average order value, average age
Minimum: Find the smallest value
- Example: Lowest price, earliest date
Maximum: Find the largest value
- Example: Highest price, most recent date
How it works
- Choose dimensions (what to group by): Categories like Region, Product, Date
- Choose measures (what to calculate): Metrics like Total Sales, Average Price, Order Count
- Results show one row per unique combination of dimensions
Time-based grouping: When grouping by dates, you can choose the time period:
- Second, Minute, Hour (for detailed timestamps)
- Day (daily analysis)
- Week (weekly summaries)
- Month (monthly trends)
- Quarter (quarterly reports)
- Year (yearly comparisons)
Examples
- Total sales by region: Group by "Region", Sum of "Sales Amount"
- Average order value by product: Group by "Product Name", Average of "Order Value"
- Monthly revenue: Group by "Order Date" (by Month), Sum of "Revenue"
- Customer count by city: Group by "City", Count of "Customer ID"
Tips
- You can group by multiple dimensions (e.g., Region and Product)
- You can calculate multiple measures (e.g., Total Sales and Average Price)
- Use descriptive names for your measures
- For dates, choose the right time granularity for your analysis
- This operation enables drill-down features in charts
Custom Operation
What it does: Apply advanced transformations using custom Python expressions. This is for advanced users who need operations beyond the standard options.
When to use it
- You need transformations not available in other operations
- You have complex business logic to implement
- You need advanced data manipulation
- You're comfortable with Python programming
What you can do
- Access all your columns as variables
- Use Python expressions to transform data
- Apply complex conditional logic
- Perform advanced calculations
Example
Create ranking or apply windowing functions that aren't available through the standard operations.
Important notes:
- Requires knowledge of Python and data manipulation
- Use only when standard operations don't meet your needs
- Test carefully before applying to large datasets
- The expression must return a valid data table