
The Agent Home Page is a dynamic, customizable dashboard designed to give support agents a comprehensive overview of their daily tasks, performance metrics, and customer satisfaction levels. It acts as the central hub for agents to track their productivity and prioritize their workflow.
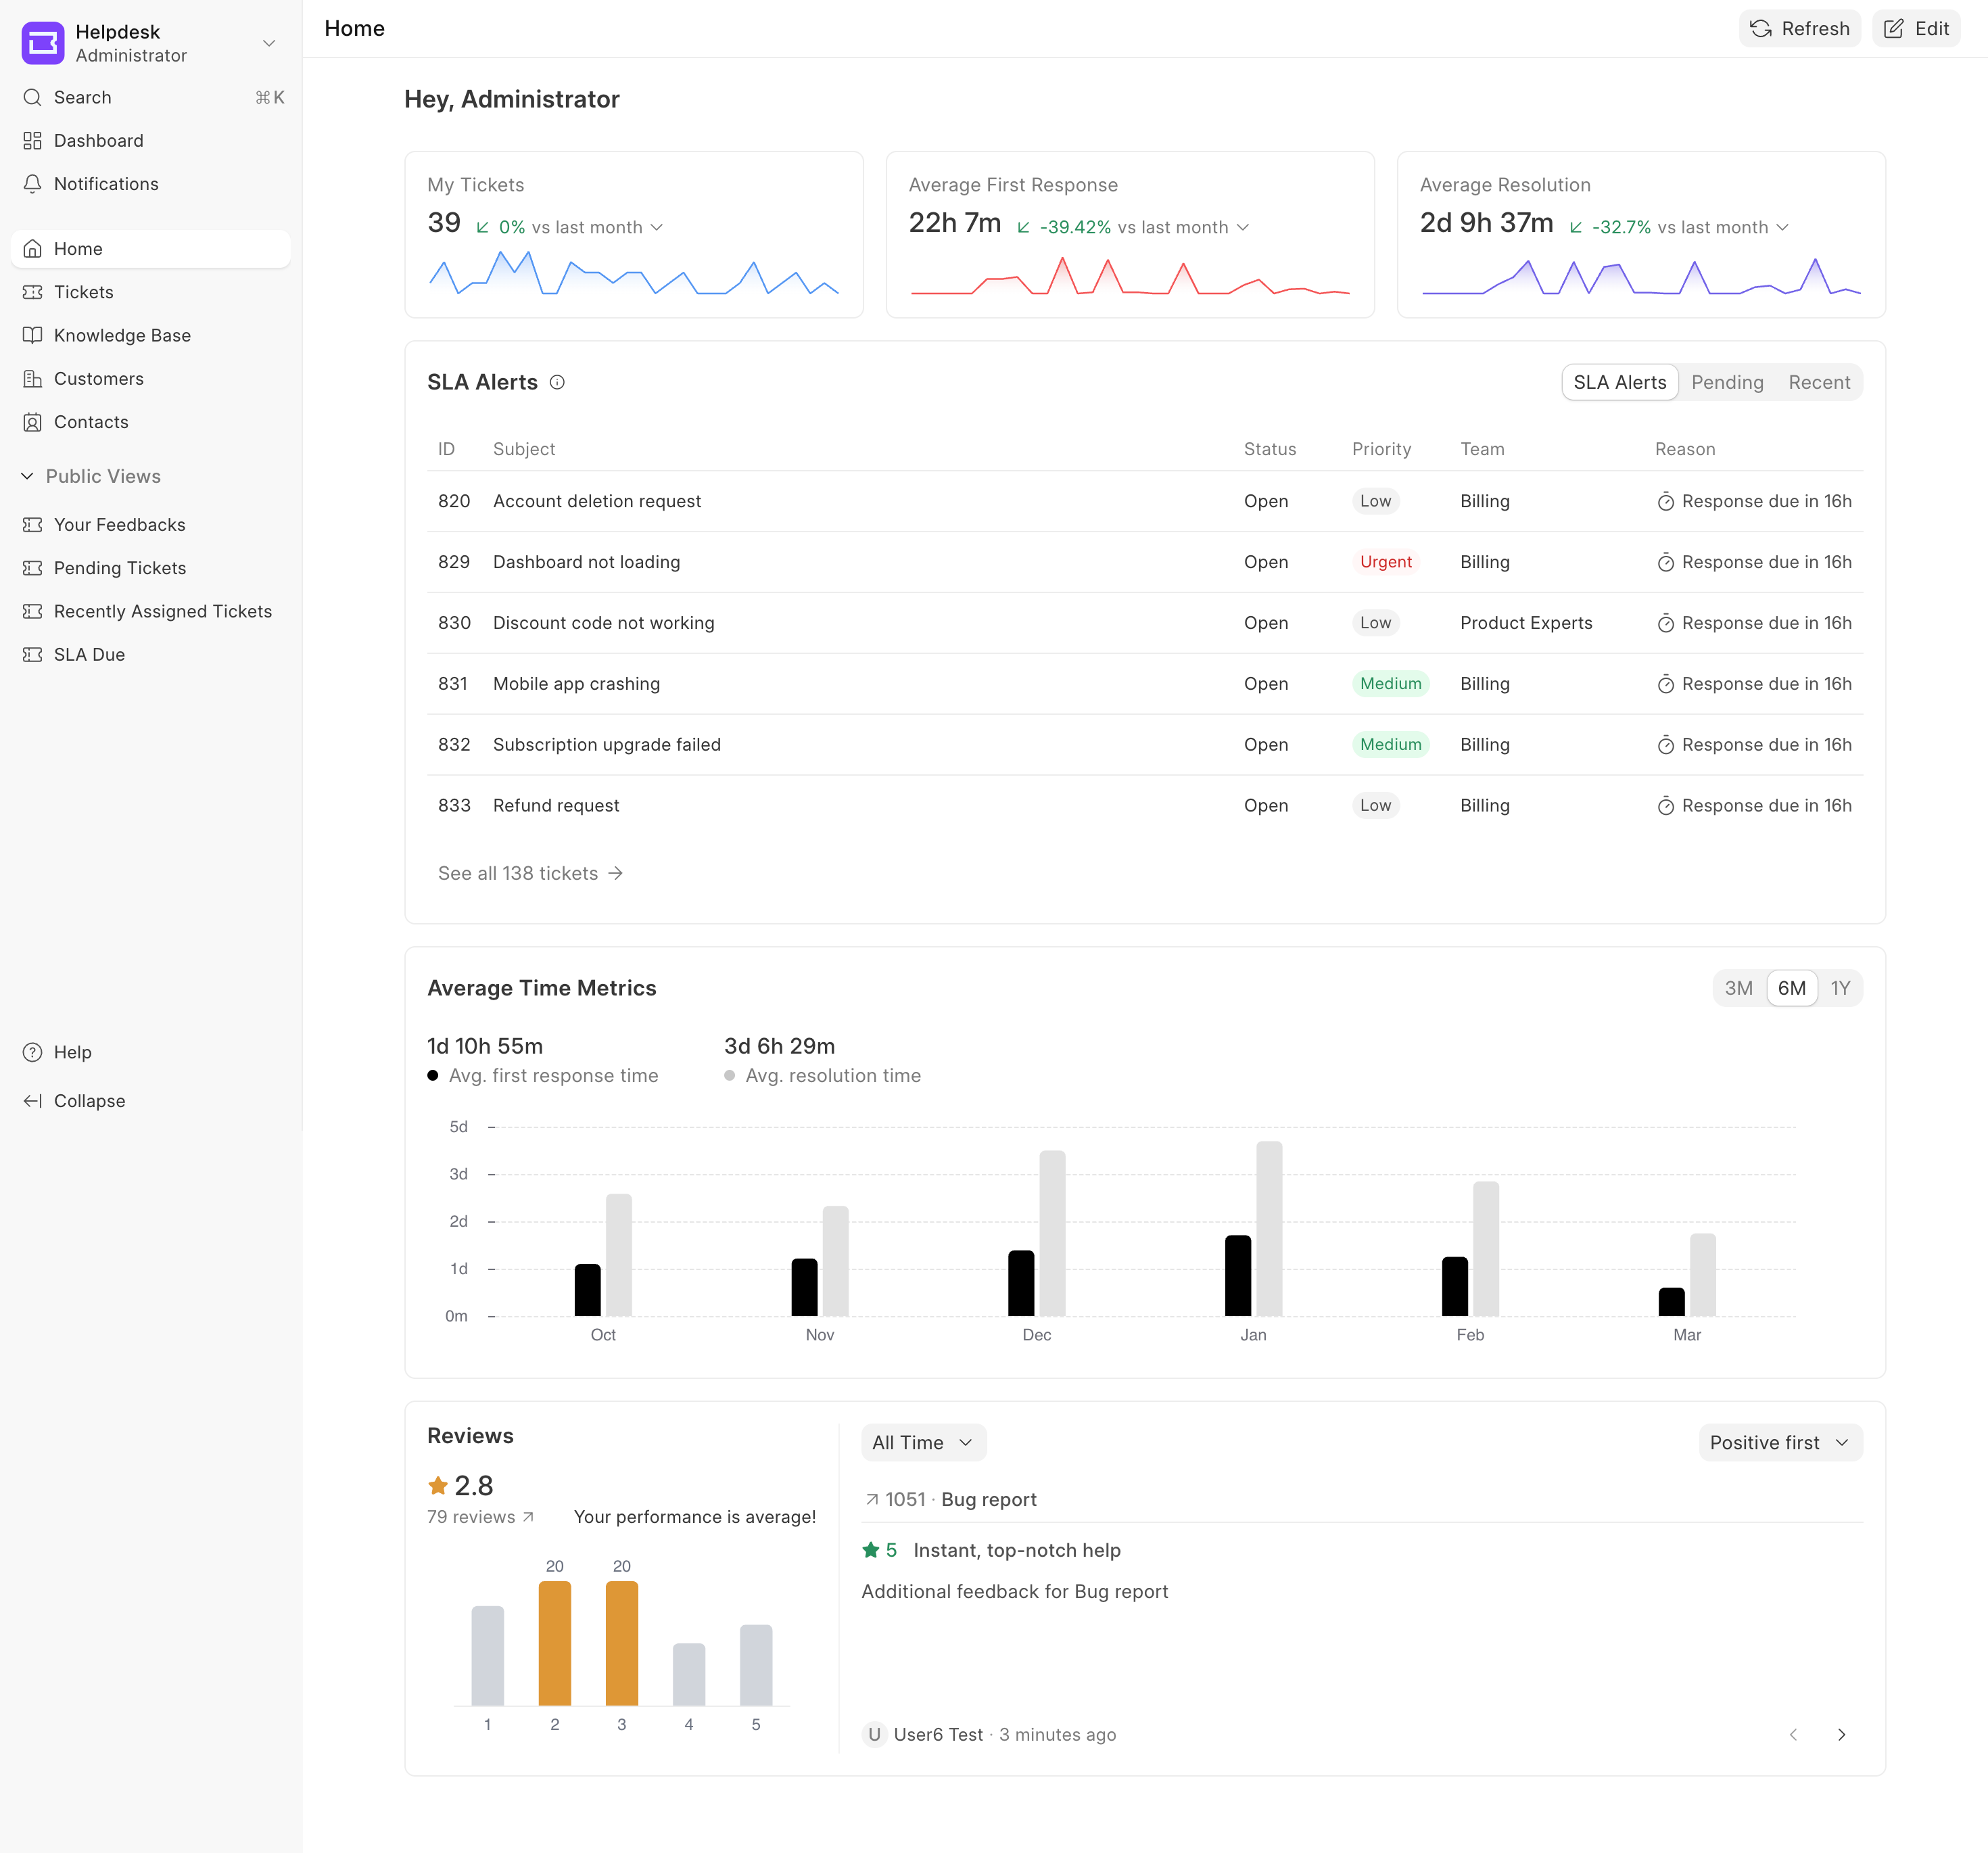 Agent Home Page
Key Features
- Customizable Layout: Drag, drop, resize, and reorder widgets to suit individual preferences.
- Real-time Metrics: Data is fetched directly from the Helpdesk backend to ensure agents are always looking at the most up-to-date information.
- Period Filtering: Most widgets support quick time-duration toggles (e.g., Last week, Last month, Last 3 months) to analyze trends over different periods.
- Quick Actions: Clickable links within widgets allow agents to jump directly to specific tickets or filtered ticket lists.
Available Dashboard Widgets
1. My Tickets
A metric card that displays the total number of tickets assigned to the agent for a selected period.
- Visuals: Includes a line chart tracking ticket volume over time.
- Insights: Shows a percentage change (increase or decrease) compared to the previous duration (e.g., vs last month), highlighting volume trends.
2. Average First Response Time
A dedicated card tracks how quickly an agent sends the first reply to a customer.
- Visuals: Rendered with a red-themed line chart and gradient.
- Insights: Displays the average time formatted in days, hours, and minutes, along with the percentage change to monitor responsiveness improvements.
3. Average Resolution Time
A dedicated card tracking the average time taken to fully resolve and close tickets.
- Visuals: Rendered with a purple-themed line chart and gradient.
- Insights: Similar to the First Response card, it shows the formatted average time and percentage change, helping agents gauge their problem-solving efficiency.
4. Average Time Metrics
A comprehensive bar chart widget that compares the "Average First Response Time" and "Average Resolution Time" side-by-side.
- Visuals: Dual-bar chart visualization.
- Filters: Supports longer historical filters: 3 Months (3M), 6 Months (6M), and 1 Year (1Y).
- Usage: Ideal for recognizing long-term performance trends and identifying operational bottlenecks.
5. Pending Tickets
An actionable list view of tickets requiring the agent's attention. This widget is categorized into three distinct tabs:
- SLA Alerts: Tickets that are approaching or have already breached their Service Level Agreement (SLA). Flags overdue items in red.
- Pending: Tickets currently awaiting an agent response.
- Recent: New tickets assigned to the agent within the last 24 hours.
- Details Displayed: Ticket ID, Subject, Status, Priority (color-coded badges), Team/Group, and Reason (e.g., upcoming SLA, pending status).
6. Reviews (Recent Feedback)
A two-panel widget summarizing customer satisfaction and recent feedback.
- Left Panel (Summary): Displays the overall average star rating (1 to 5), total number of reviews, a performance assessment label (e.g., "excellent", "good"), and a bar chart showing the distribution of ratings.
- Right Panel (Detailed Feedback): A carousel of individual customer reviews. Agents can navigate through reviews using the previous/next buttons.
- Filters: Agents can filter reviews by period (All Time, Last Week, Last Month, Last 3 Months) and sort them (Positive first, Negative first).
Managing the Dashboard
Agents can tailor the Home Page to display only the metrics that matter most to them.
Editing the Layout
- Click the Edit button in the top right corner of the header.
- Move: Click and drag any widget to a new position on the grid.
- Resize: Drag the bottom-right corner of a widget to expand or shrink its size (widgets have predefined minimum and maximum dimensions to preserve UI integrity).
- Remove: Hover over a widget while in edit mode and click the Trash icon in the top right corner to remove it from the dashboard.
Adding New Widgets
- While in Edit mode (or via the New dropdown if the dashboard is empty), click the New button in the header.
- Select a widget from the dropdown list (e.g., "Pending Tickets", "Reviews").
- The new widget will automatically appear at the top of the dashboard, ready to be placed.
Saving or Resetting
- Save: Once the layout is arranged as desired, click Save to apply the changes to your user profile.
- Cancel: Click Cancel to discard any unsaved layout changes and revert to the previous state.
- Reset: If the layout has been customized but you want to return to the system default, enter Edit mode and click the Reset button.