

















Profit and Loss Statement
The Profit and Loss Statement shows the income, the expenses, and the profit or loss of your company in each period. Use it to compare the profit of months, quarters, or years, or to find the total profit for a date range.
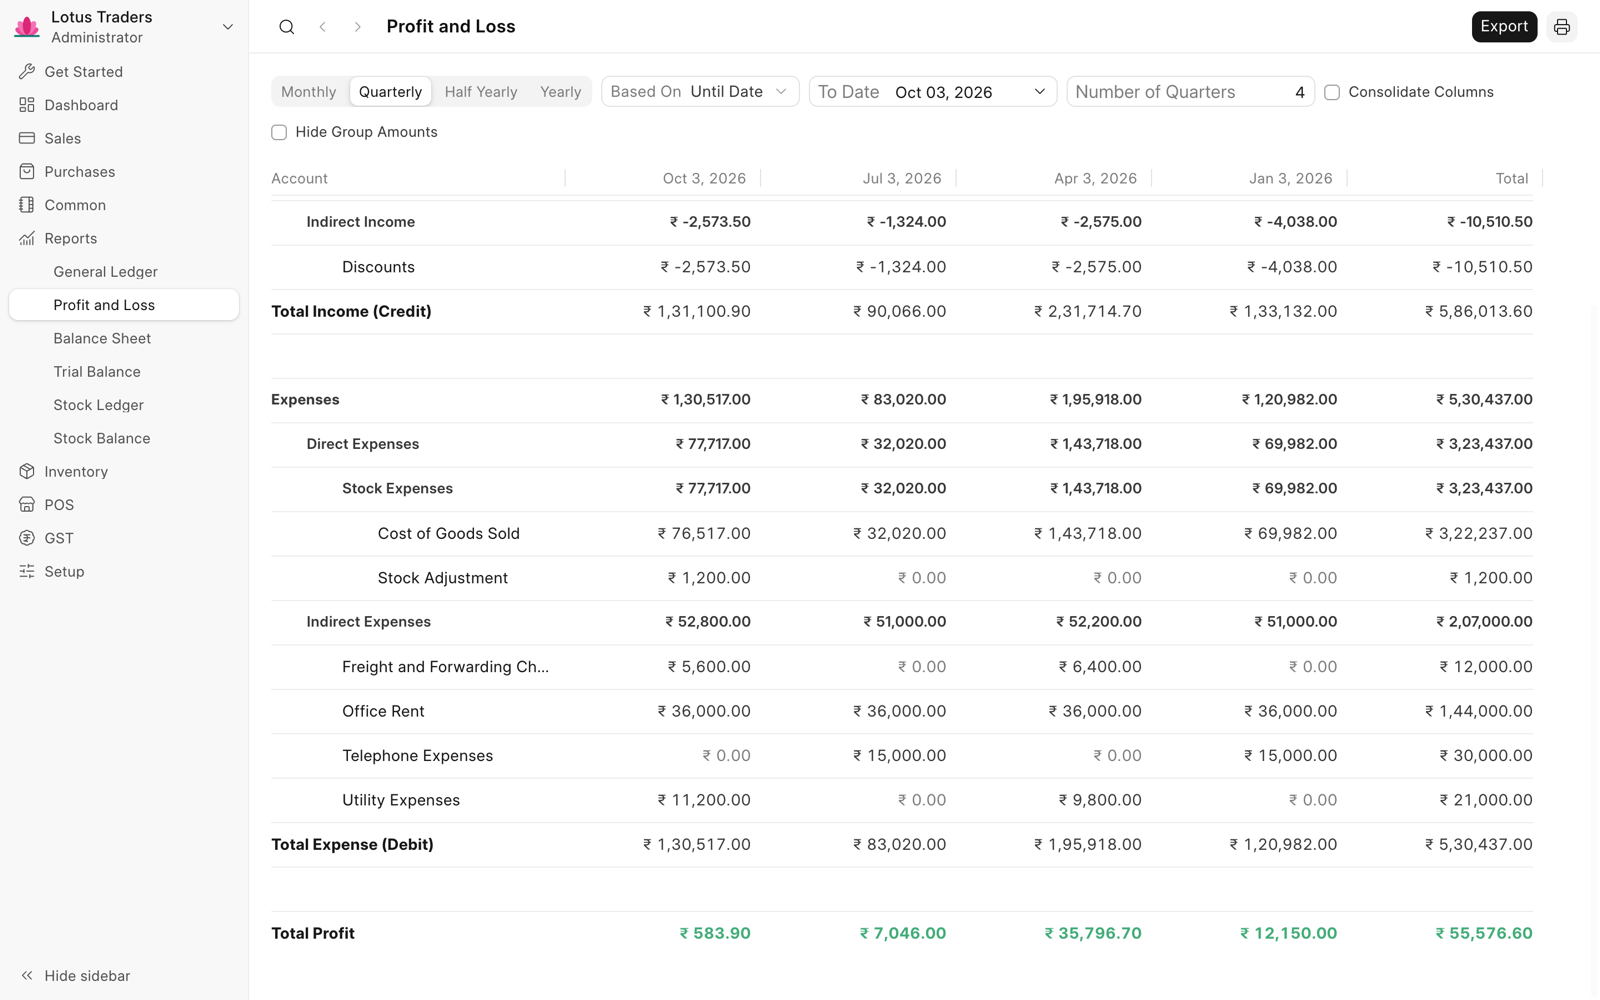
Click Reports > Profit and Loss in the sidebar. On a phone, tap Reports in the bottom tabs, tap the report title, and then tap Profit and Loss. The report opens with three monthly periods. The newest period ends today.
For the controls that all reports share, such as the filters on a phone, export, and print, see Reports.
How Frappe Books Calculates the Profit
Frappe Books uses the ledger entries of your submitted documents. It does not use draft documents or cancelled documents. Each column shows only the entries of its period.
| Row | Shows |
|---|---|
| The income accounts | For each account with the root type Income, the credits minus the debits |
| Total Income (Credit) | The total of all the income accounts |
| The expense accounts | For each account with the root type Expense, the debits minus the credits |
| Total Expense (Debit) | The total of all the expense accounts |
| Total Profit | The total income minus the total expenses |
A group account shows the total of the accounts below it. The report shows only the accounts that have ledger entries in the periods. On a computer, a profit shows in green and a loss shows as a negative amount in red.
Frappe Books does not move the profit to an equity account at the end of the fiscal year. For more information, see The Profit in the Balance Sheet.
Filters
| Filter | Description |
|---|---|
| Periodicity | The length of each period: Monthly, Quarterly, Half Yearly, or Yearly. The default is Monthly. |
| Based On | How you set the dates: Until Date or Fiscal Year. The default is Until Date. |
| To Date | For Until Date. The last day of the newest period. The default is today. |
| Number of Months | For Until Date. The number of periods. The label follows the periodicity, such as Number of Quarters. The default is 3. |
| From Year and To Year | For Fiscal Year. The report starts with the fiscal year that starts in From Year. It ends with the fiscal year that ends in To Year. The default is the current fiscal year. |
| Consolidate Columns | Shows one column with the total of the full date range, instead of one column for each period. |
| Hide Group Amounts | Shows amounts only for the ledger accounts and the total rows. |
With Until Date, each earlier period ends one period before the next one. For example, set To Date to 15 September 2026 and keep three monthly periods. The periods are 16 August to 15 September, 16 July to 15 August, and 16 June to 15 July. If the To Date is the last day of a month, each period is a full calendar month.
The dates of your fiscal year are in the General settings. For more information, see Settings.
Read the Report
On a computer, each column after the accounts shows one period. The newest period is first. The column header is the last day of the period. When the report has more than one period, the last column is Total.
On a phone, the report shows one column. By default, it shows Total. To show one period, tap Column, and then tap the period. To see the amounts of an account in all the periods, tap the account.