

















Reports show the data of your submitted documents in tables. A report does not change your data.
Available Reports
Click Reports in the sidebar, and then click a report. The GST reports are in the GST group. On a phone, tap Reports in the bottom tabs.
| Report | Shows |
|---|---|
| General Ledger | Each accounting entry, with a running balance. |
| Profit And Loss | The income, the expenses, and the profit for each period. |
| Balance Sheet | Your assets, liabilities, and equity at the end of each period. |
| Trial Balance | The opening and closing balances, and the debits and credits, of each account. |
| Stock Ledger | Each stock entry of your items. |
| Stock Balance | The quantity and the value of each item in each location. |
| GSTR1 and GSTR2 | Your sales and your purchases for the GST returns. |
The stock reports show only when Enable Inventory is on in the General settings. The GST group shows only when your company has a GSTIN. All roles can open and export every report.
Use a Report on a Computer
Filters
The filters are below the page header. When you change a filter, Frappe Books runs the report again. For the filters of each report, see the page of that report.
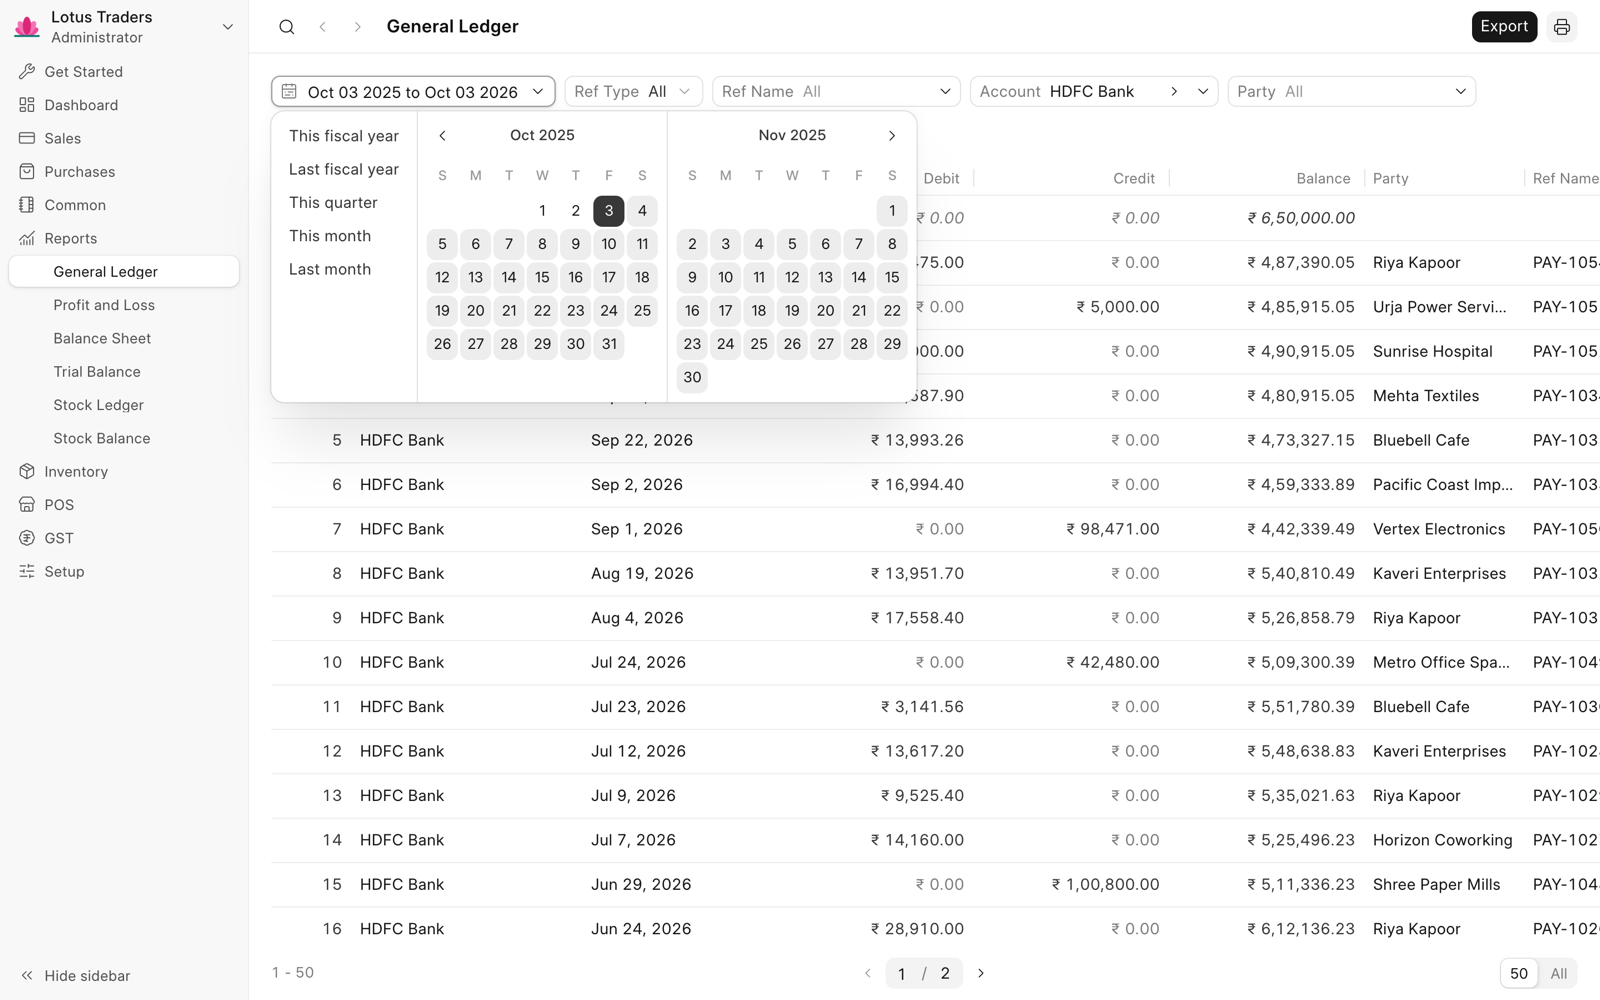
A From Date and a To Date show as one date range field. Click it, and then click the first date and the last date. You can also click a preset, such as This fiscal year or Last month.
The filters stay set until you reload the page.
Columns and Rows
- To change the width of a column, drag the line at the right side of its header. To fit the column to its contents, double-click that line.
- In Profit and Loss, Balance Sheet, and Trial Balance, click a group account to hide or show the accounts below it.
- General Ledger, Stock Ledger, GSTR1, and GSTR2 show 50 rows on each page. To show more rows, click 100, 500, or All at the bottom.
Export a Report
- Set the filters.
- Click Export in the page header.
- Click CSV or JSON.
The file has all the rows of the report, not only the rows of the current page. The JSON file also has the filter values.
Print a Report
- Set the filters.
- Click the printer icon in the page header, or press
Ctrl + P(Cmd + Pon macOS). - Change the print options, such as Number of rows, Print Size, Landscape, and Pick columns.
- Click Print.
Print opens the print dialog of your browser. To make a PDF file, select the PDF option in that dialog. If the message Pop-up blocked shows, allow pop-ups for your site and try again.
Use a Report on a Phone
The Reports tab opens the General Ledger, or the first report that you can open. To open a different report, tap the report title in the header, and then tap a report.
Change the Filters
- Tap the filter button at the left, below the header. You can also tap a filter that is not changed.
- Change the filters in the Filters sheet.
- Tap Apply.
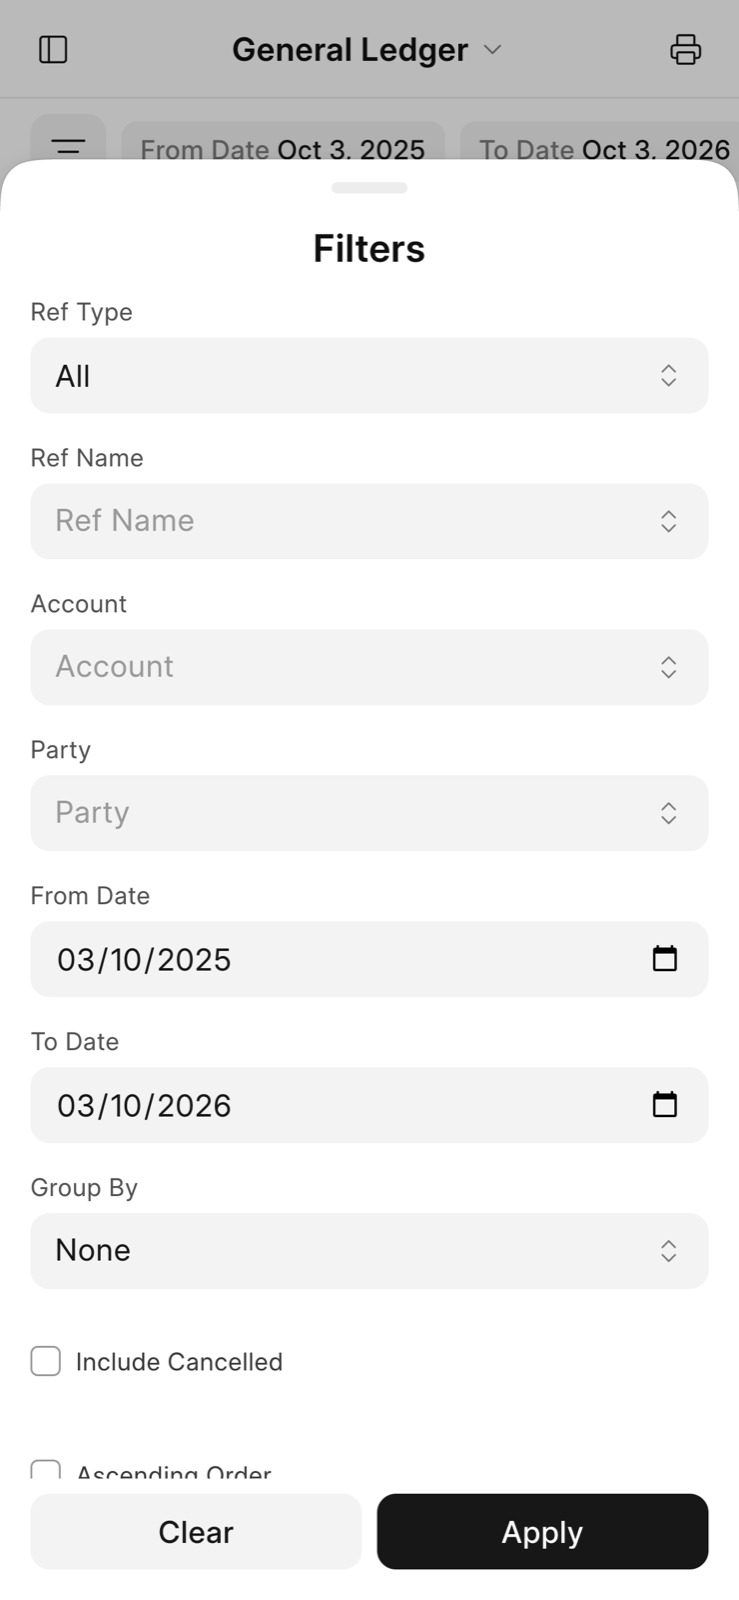
To set all the filters back to their default values, tap Clear, and then tap Apply. A changed filter shows an x. Tap it to set that filter back to its default value.
See the Rows
- General Ledger and Stock Ledger show the entries below their dates. Tap Load more to show the next 50 entries.
- In the other reports, tap a group to hide or show the rows below it.
- Tap a row to see all its columns. When the row comes from a document, the sheet also has a button that opens the document.
- Profit and Loss and Balance Sheet show one period at a time. To show a different period, tap Column, and then tap a period.
To print a report, tap the printer icon in the header, and then tap Print at the bottom of the page.