
Frappe Cloud logs a lot of data while your site is running like Request Logs, Site Logs, CPU Time, etc.
Site Analytics
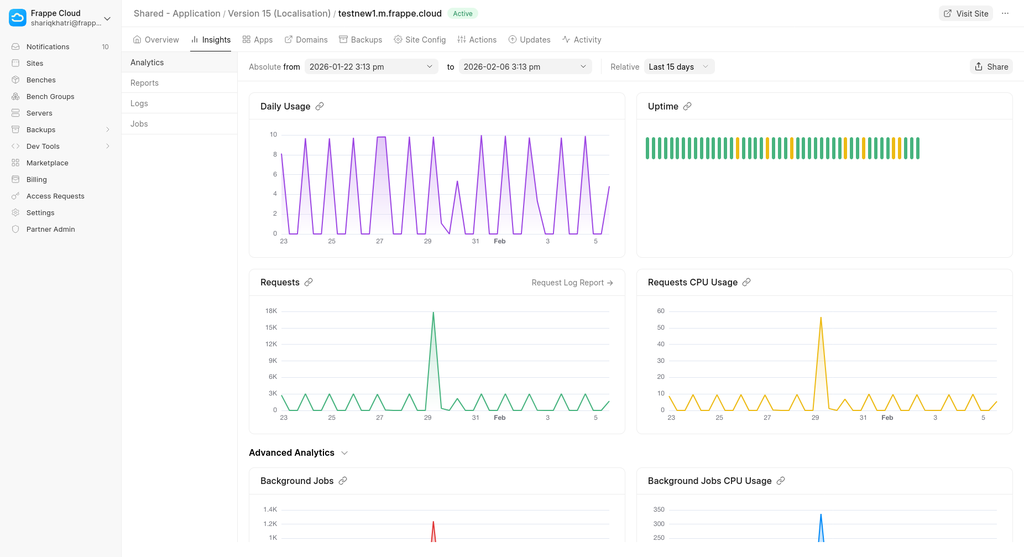
The Analytics tabs shows a lot of charts:
- Requests - Number of Requests (per minute)
- CPU Usage - CPU Usage of Requests
- Background Jobs - Number of Background Jobs
- Background Jobs CPU Usage - CPU Usage of Background Jobs
- Usage Counter - Cumulative CPU Usage of Requests. You can also see the Daily CPU Time Limit line, you can monitor this chart to know when you need to upgrade your Plan.
- Uptime - Uptime of the web worker and scheduler. Collected every 3 minutes.
Analytics are only available after Setup Wizard is completed. Uptime status is collected every minute.
Investigating high usage
Primarily for investigating high usage, you should look at the Requests Duration By Path and Background Job Duration By Path graphs. This will give you an idea of which endpoints in your site take most time/requests.
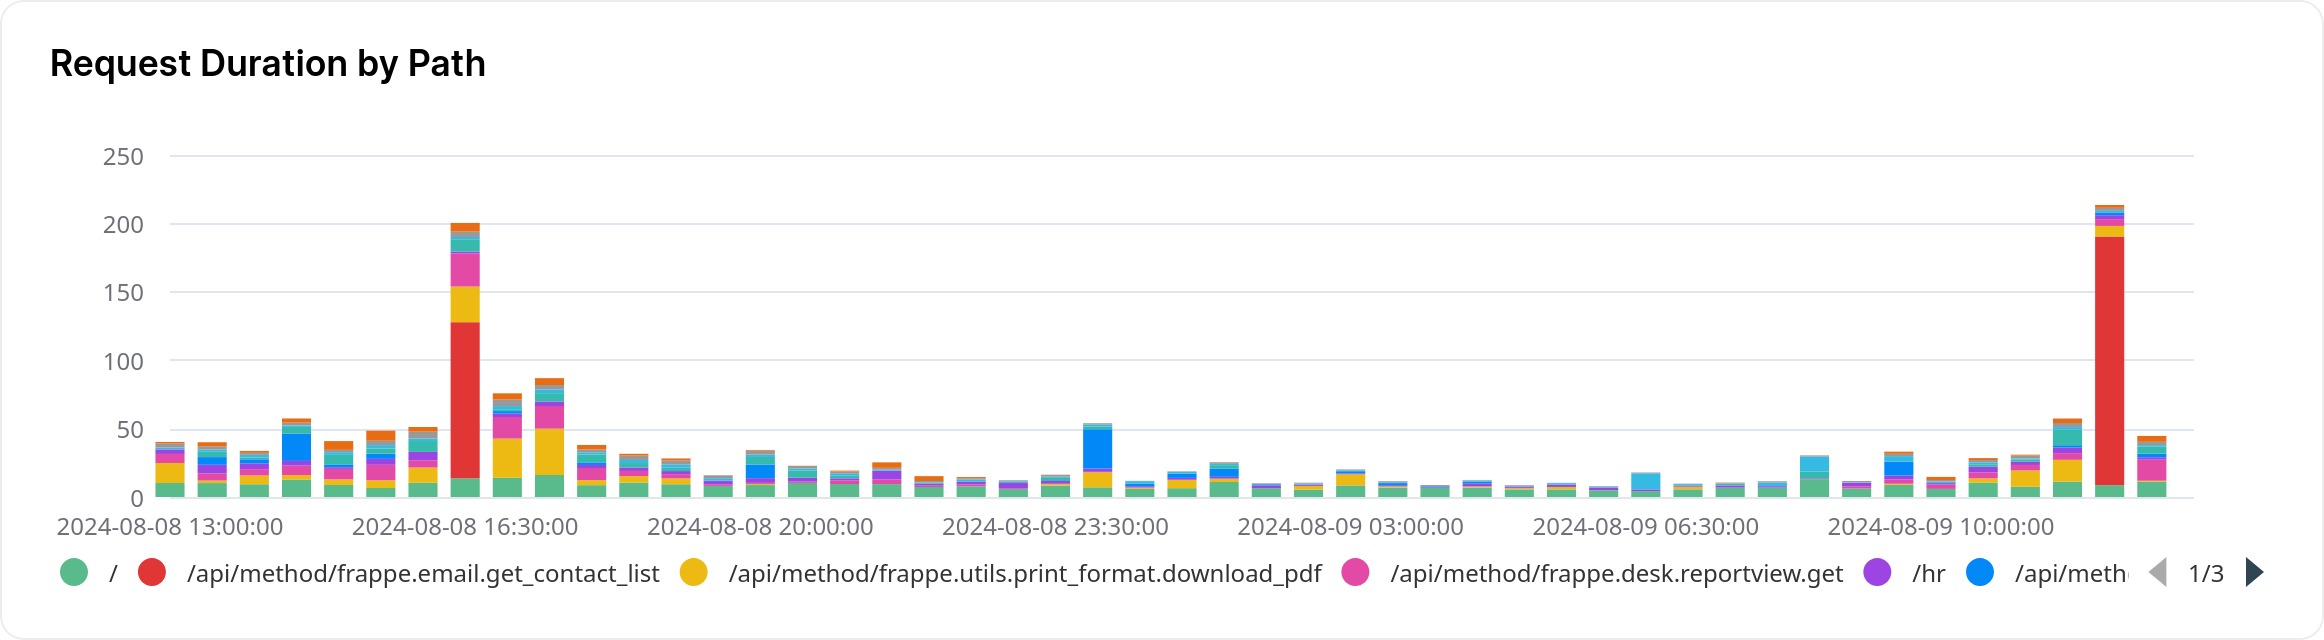
Here, the red bars are seem to take relatively long and should be looked into.
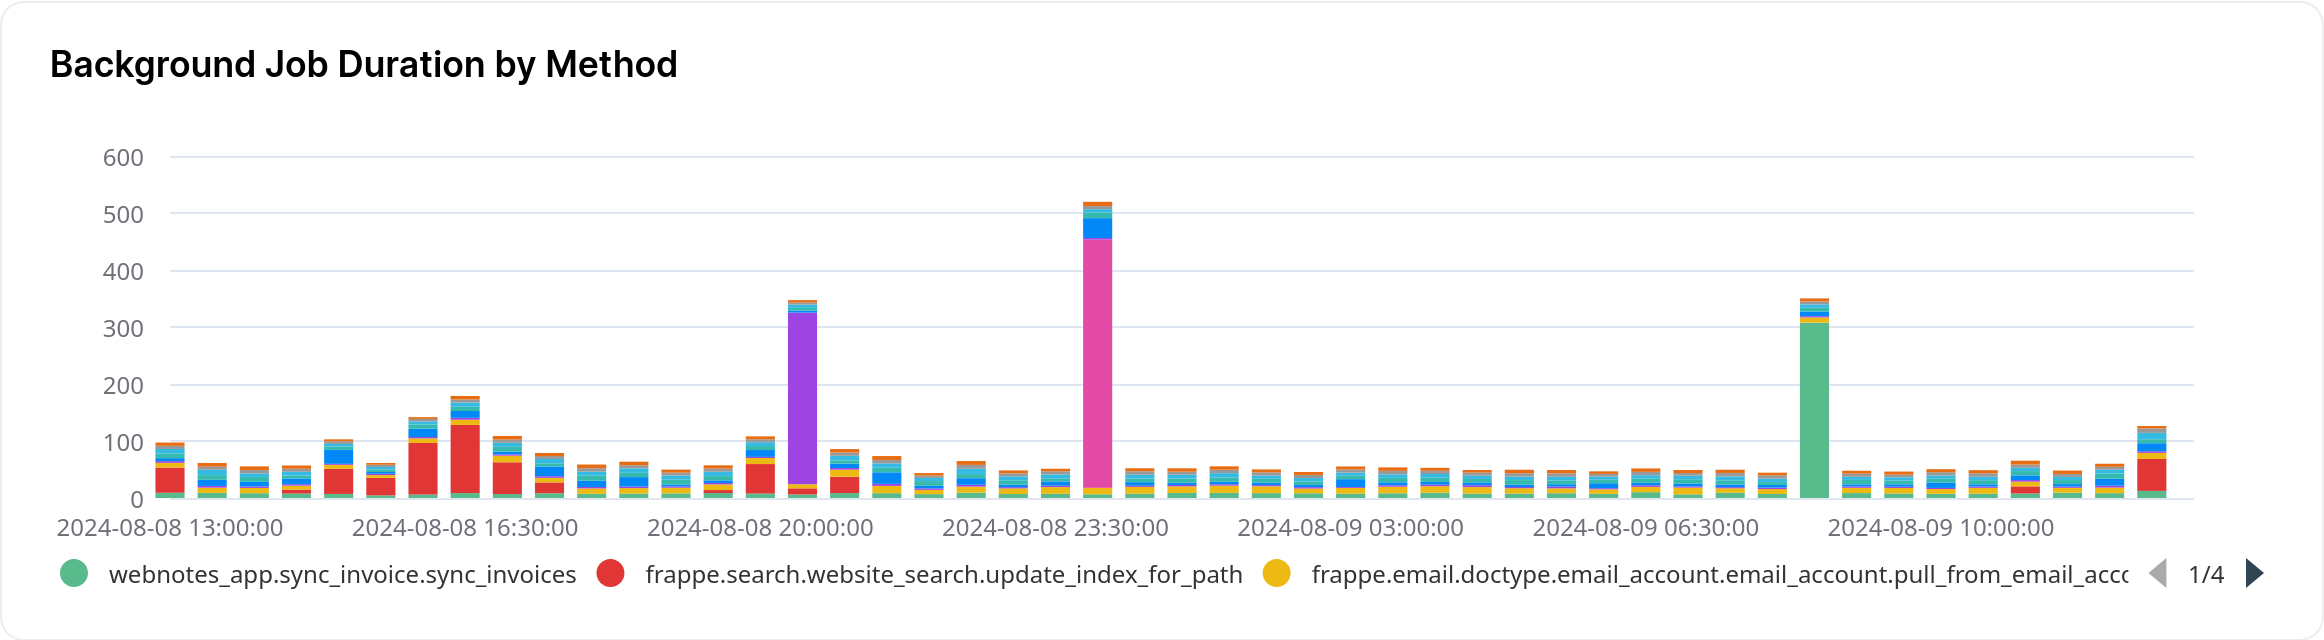
It is sorted in descending order, so the first endpoints in the list are usually slowest.
Database Storage Usage
How often is database usage synced ?
Database usage is synced from your site to the Frappe Cloud dashboard in every 6 hrs.
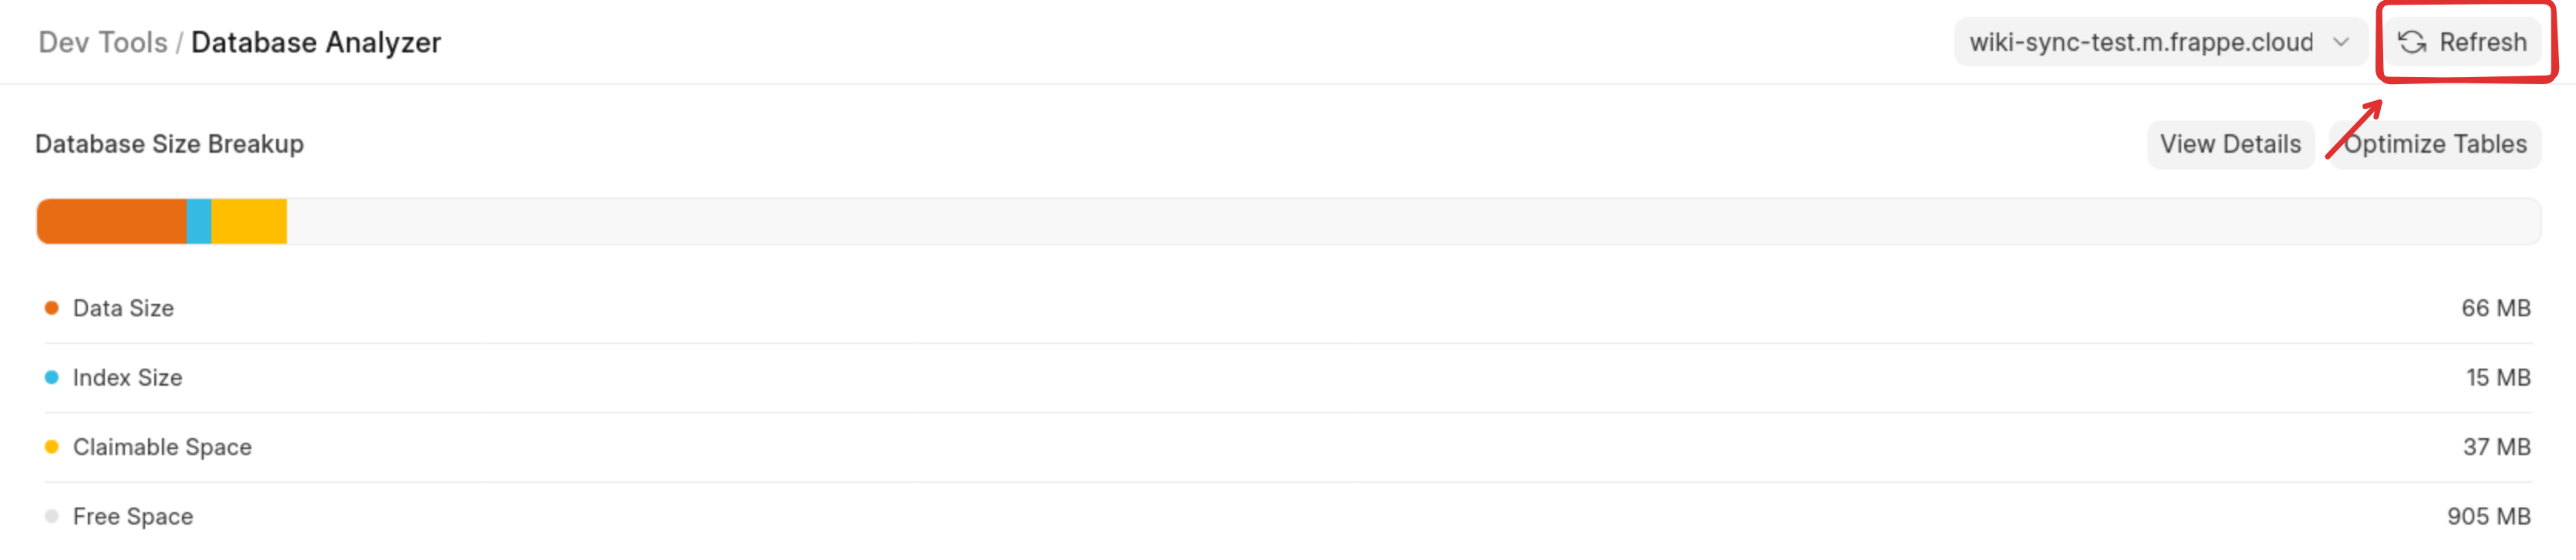
How to refresh database usage on demand ?
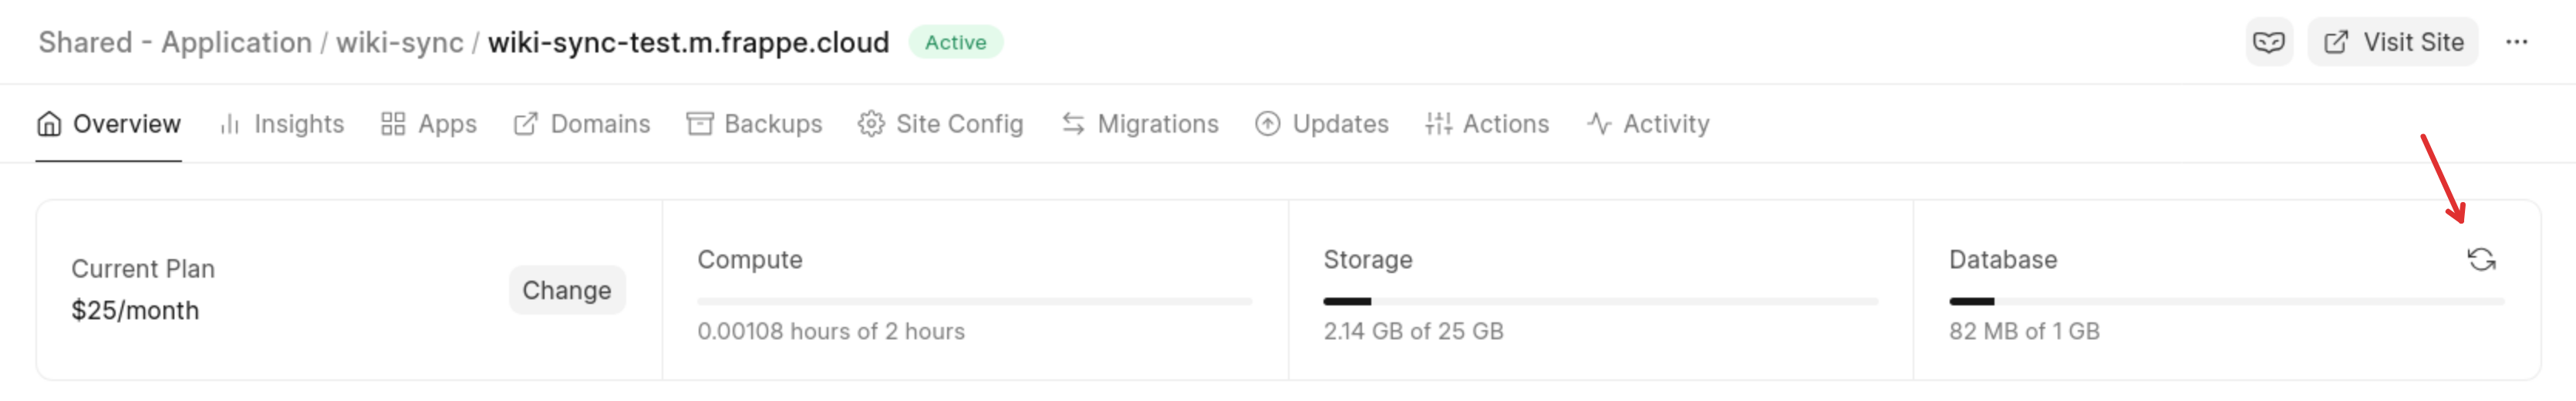
If you’ve made changes or want to view the most up-to-date database usage, you can manually trigger a usage refresh.
You can do this from the Site Overview page or the DB Analyzer.
Note: This action also purges the Information Schema cache. After refreshing, the usage reported by Frappe Cloud and the DB Storage Report (Framework) / DB Analyzer will be consistent.
Limit: This action can be performed once every 15 minutes.
Discrepancy Between FC DB Usage and Storage Reports
You may sometimes notice a difference between the database usage reported by Frappe Cloud and the figures shown in the DB Storage Report (Framework) or the Frappe Cloud DB Analyzer.
Reason :
Frappe Cloud calculates database usage using a custom table parser designed to avoid performance impact on the database. This approach allows it to provide more accurate information, as it does not rely on cached data.
In contrast, the DB Storage Report in the Framework and the DB Analyzer on Frappe Cloud depend on MariaDB’s Information Schema tables. That data is typically cached and only refreshed under specific conditions. As a result, they may contain stale data, which can lead to discrepancies in reported usage.
Solution :
To view the most up-to-date database usage, you need to refresh the Information Schema cache.
You can do this by triggering a database usage refresh from either from the Site Overview page, or the DB Analyzer.
For more details, please refer to the relevant documentation.
Monitoring Disabled
Frappe Cloud uses a monitoring server to check if your site is online and healthy.
For example, if your site domain is example.com, our monitoring server will send a request to:
https://example.com/api/method/ping
Your site should reply with:
{"message": "pong"}
and return an HTTP 200 status code.
Why Monitoring May Be Disabled
Monitoring can be turned off automatically if your site can’t be reached. Common reasons include:
- The primary domain has expired
- DNS records are incorrect
- The domain is behind Cloudflare or another CDN that blocks the ping request
- Custom app changes cause the ping endpoint to fail
If our system detects that your site is active but can’t verify uptime through your domain, monitoring will be disabled and you’ll get an mail for the same.
How to Re-Enable Monitoring
- Go to your Frappe Cloud Dashboard and open your Site Overview page.
- At the top, you’ll see an option to Enable Monitoring.
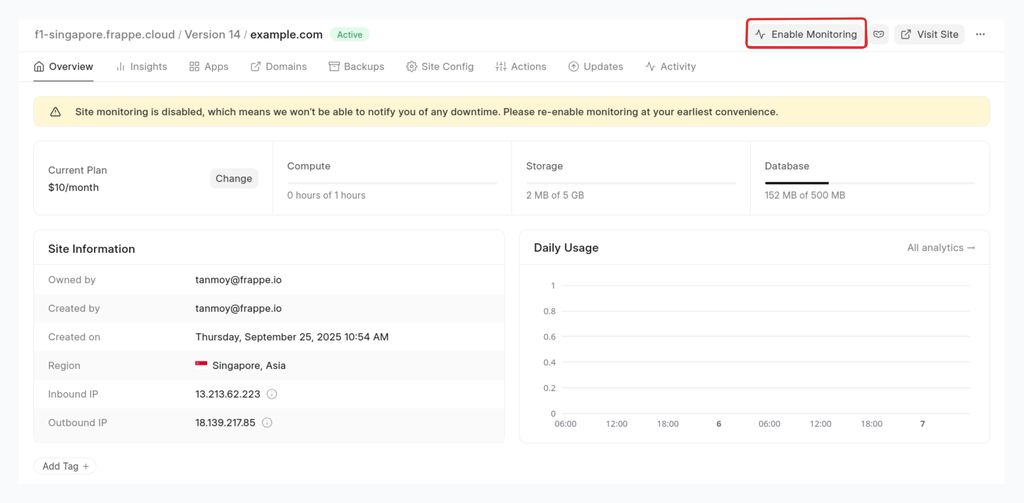
- Click the button — you’ll see the reason why monitoring was disabled.
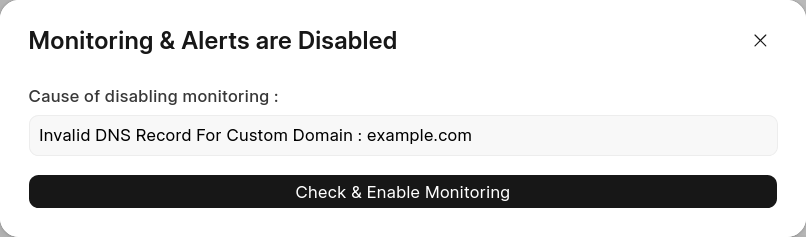
- Click Check & Enable Monitoring to verify your setup and turn monitoring back on.
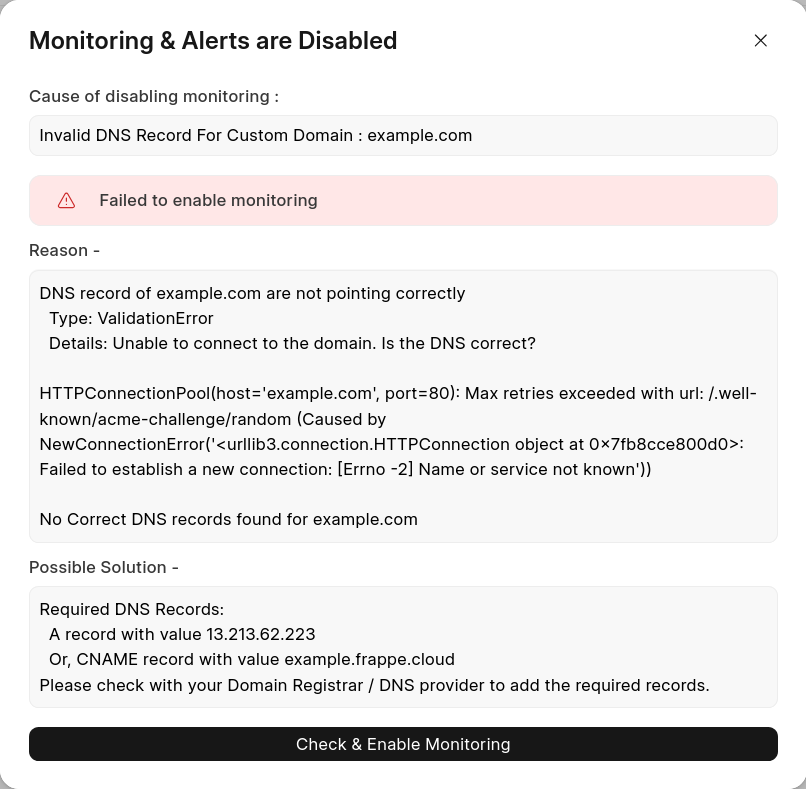 If the check fails, you’ll see details about what went wrong and how to fix it.