
Site Slow: 504 Gateway timeout
This can happen when web workers on your site are all busy with previous requests. This can even cause a bench to go down! This is caused by slow apis. Most of the time these are reports which take too long to run. You can confirm the same from your analytics page by looking at Slowest Requests chart as shown above.
Some common endpoints and their meanings are given below
| Endpoint | Meaning |
|---|---|
/api/method/frappe.desk.query_report.run |
Reports from Report doctype |
/api/method/frappe.desk.reportview.get |
Loading of report or List view of a doctype. In case lot of columns are being fetched with filters on various others, it can get slow depending on indexes. |
/api/method/run_doc_method |
This indicates a whitelisted method in a Document controller is being called |
You can also use frappe's built in Recorder in your site to figure out what's wrong. Remember to turn it off once you're done to prevent slowing down your site further.
If the endpoint is not something you can optimize, you can try converting the same into a background job.
If you own a dedicated server, you should also check your server analytics to see if you're reaching CPU limits for either of your servers (Application or Database)
Slow reports
if you see /api/method/frappe.desk.query_report.run at the top of the list. This is a good indication that you can convert such reports into Prepared Reports so they run in background and allow you to freely use your site.

What does "Other" mean in chart
“Other” bucket is attributed to all requests that aren’t the top slowest requests. When “Other” is most prominent, it usually means a specific pattern of endpoint is slow. For example:
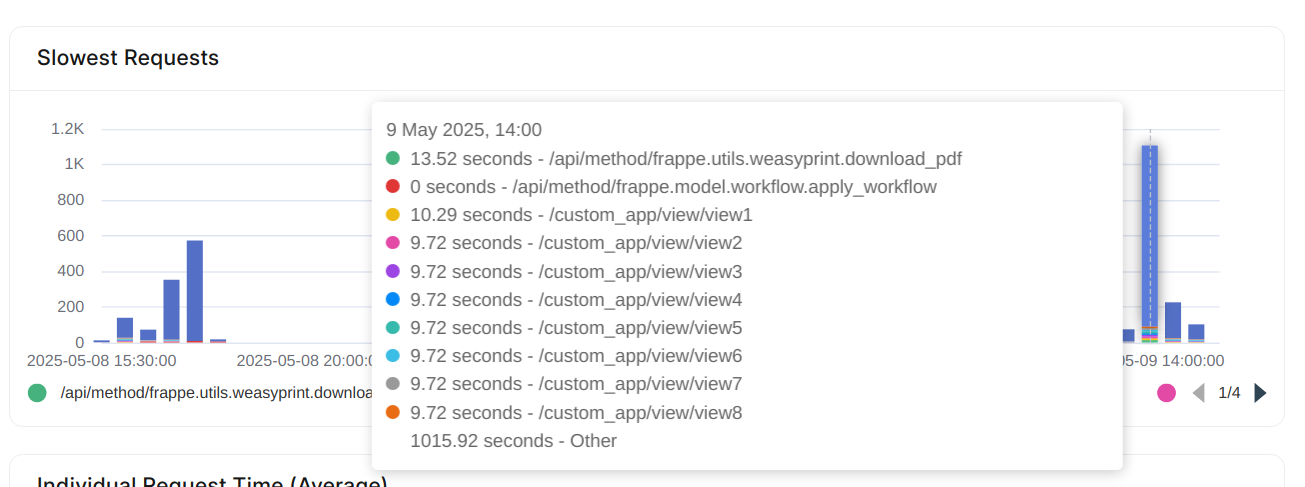
Here, the /custom_app/view/ endpoint is slow and should be investigated by the developer for the same.
If you don't see a pattern of sorts and "Other" is still the slowest endpoint, then it's likely that the server itself is slow and should be looked into.