
We have now added a feature to expose bench level metrics.
Available under the Bench Analytics tab on the server page
Smiliar to how users are exposed to site level analytics, it is now possible to see how benches in a selected release group are performing and early detect problems using this as well.
We currently expose the following metrics
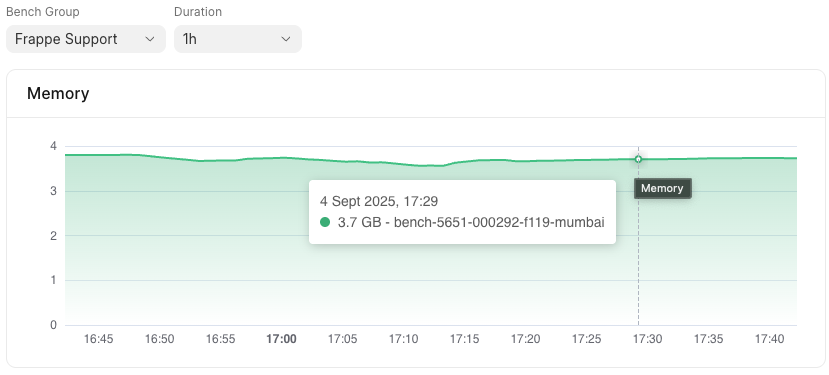
- Memory - Shows how much RAM is a bench in a release group eating up over a period of time
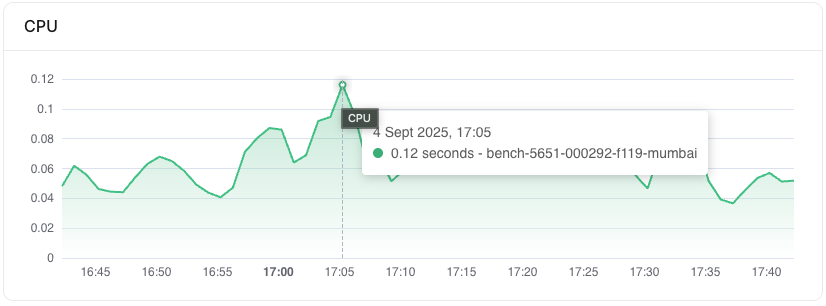
- CPU Time - Shows the amount of time your CPU is working on a process.
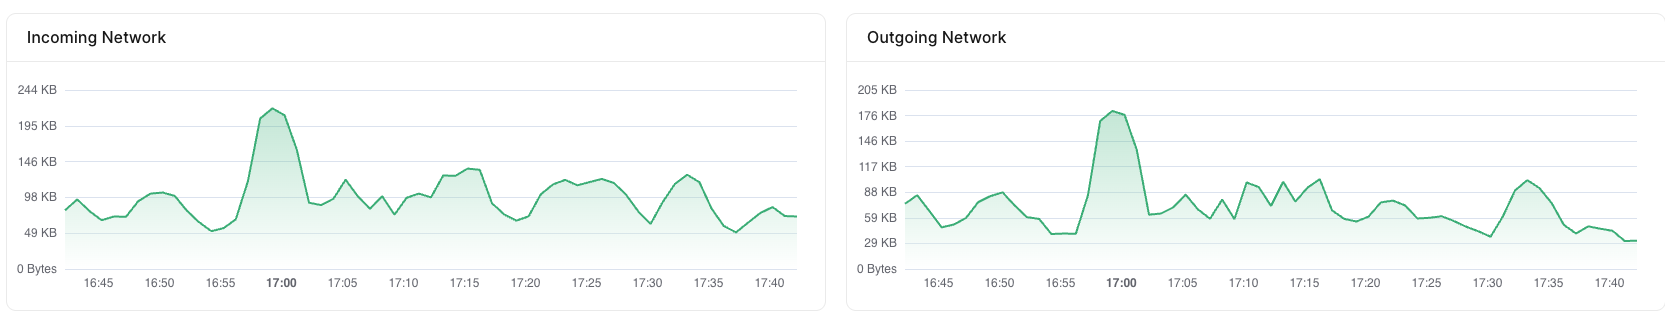
- Network I/O - Inbound and outbound network traffic from your bench.
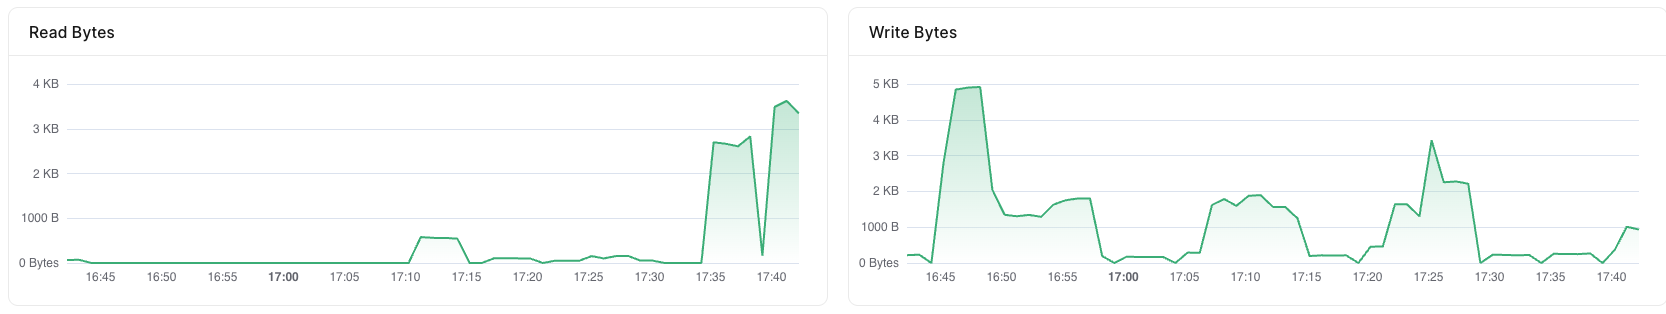
- Disk I/O - Disk level read and write operations performed by your bench.
These metrics above should ideally help in early identifying problems and also providing deeper analysis of problems
Last updated 5 months ago
Was this helpful?