
These reports help track project progress, project status, and key metrics such as timelines, costs, and resource allocation
Project Summary
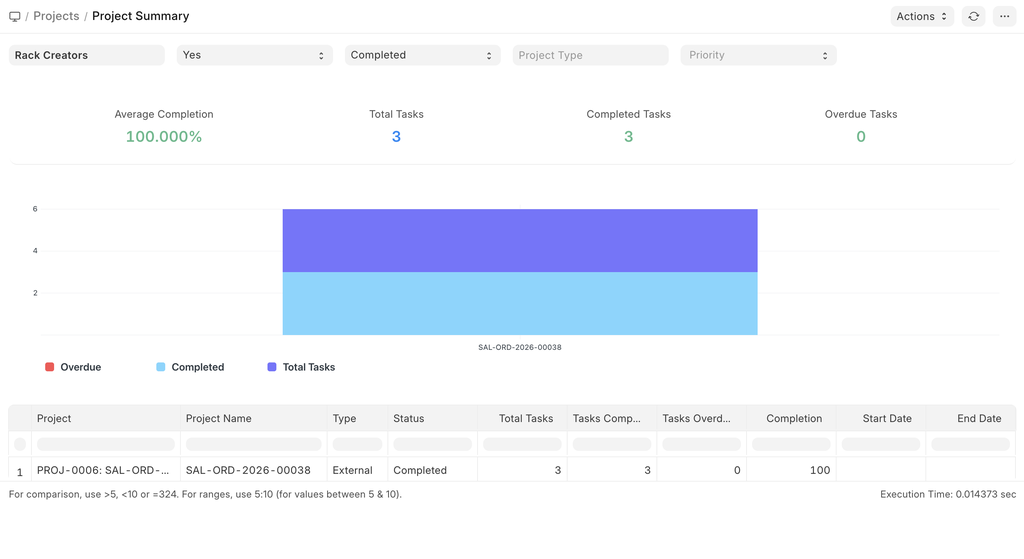
The Project Summary provides an overview of key project information, including the current project status, start and end dates, and a consolidated view of related records. It displays the number of associated Tasks and Timesheets, allowing users to quickly assess project progress and activity at a glance.
The image below shows the summary of the example we discussed in Getting started for the Rack Storage manufacturing.
 Project Summary
Daily Timesheet Summary
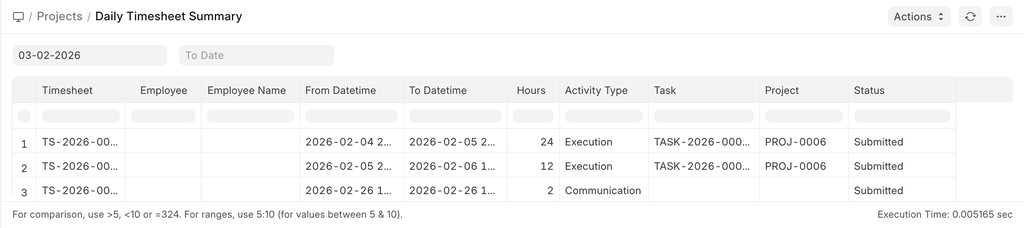
The Daily Timesheet Summary provides a consolidated view of all tasks recorded in a timesheet for a selected time period. It displays the timesheet activities along with the logged hours and the corresponding linked tasks and projects, enabling users to review daily time allocation at a glance.
 Daily Timesheet Summary
Timesheet Billing Summary
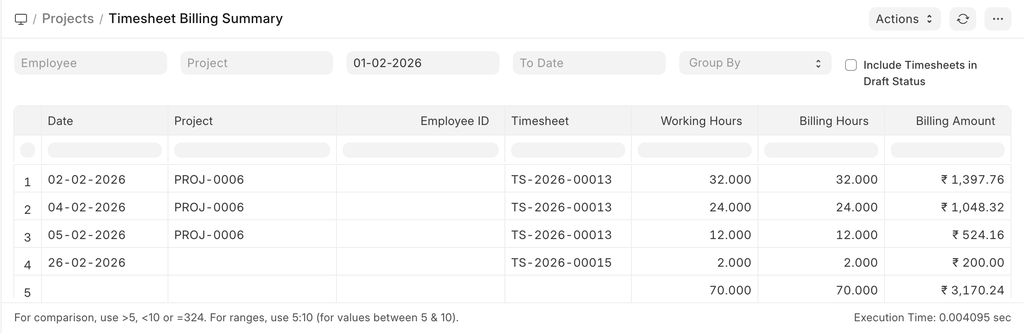
This report provides a summary of timesheet-based billing for a selected time period. It displays the total working hours along with the corresponding billable hours, billing rates, and calculated billing amounts, enabling users to review and analyze time-and-material billing at a glance.
 Timesheet Billing Summary
Project Wise Stock Tracking
This report provides visibility into stock movements associated with projects, including purchased items and issued items. It also displays key project information such as the project status, total project value, and the project start and completion dates, enabling effective tracking of material usage and overall project progress.
![]() Project wise stock tracking
Project wise stock tracking
Delayed Task Summary
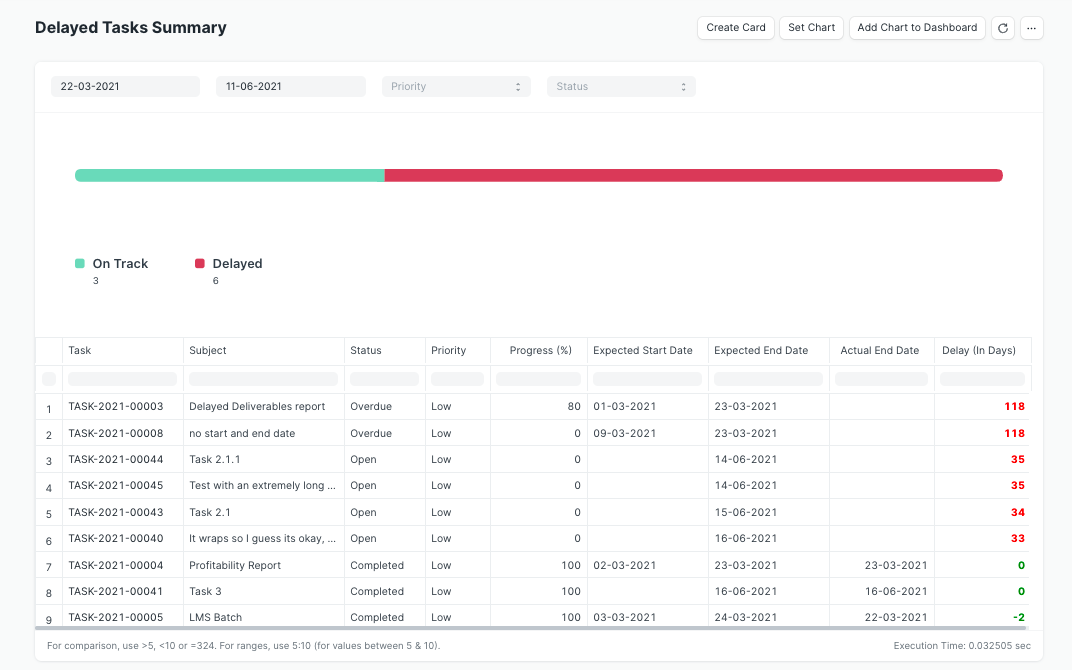
The Delayed Tasks Summary report helps identify the tasks which have exceeded their Expected End Dates. It provides visibility into both on-track and delayed tasks, along with their current progress and the expected start and end dates, enabling users to identify schedule deviations and take corrective action.
To view this report, you can go to:
Home > Projects > Reports > Delayed Tasks Summary
The report is generated based on the Task Doctype.
Calculation of Delay
Tasks have a date field called Completed On, which becomes visible when a Tasks status is changed to Completed.
Scenario 1
If a task is marked as Completed and the Completed On field is set, then the delay is calculated as the difference between the Completed On and the Expected End Date.
Delay = Completed On - Expected End Date
Scenario 2
If the Completed On field is not set, then the delay is calculated as the difference between the current date and the Expected End Date.
Delay = Current Date - Expected End Date
Chart
The chart shows the number of tasks that are On Track or Delayed based on the report generated after applying the filters.
 Delayed Tasks Summary