
Financial Report Template
What are Financial Report Templates?
Financial Report Templates help create professional financial reports automatically that fit dynamic business needs. Instead of editing reports in Excel, one can set up a template and it will generate reports like Balance Sheets, Profit & Loss statements, and Cash Flow reports with just a few clicks.
Main Components
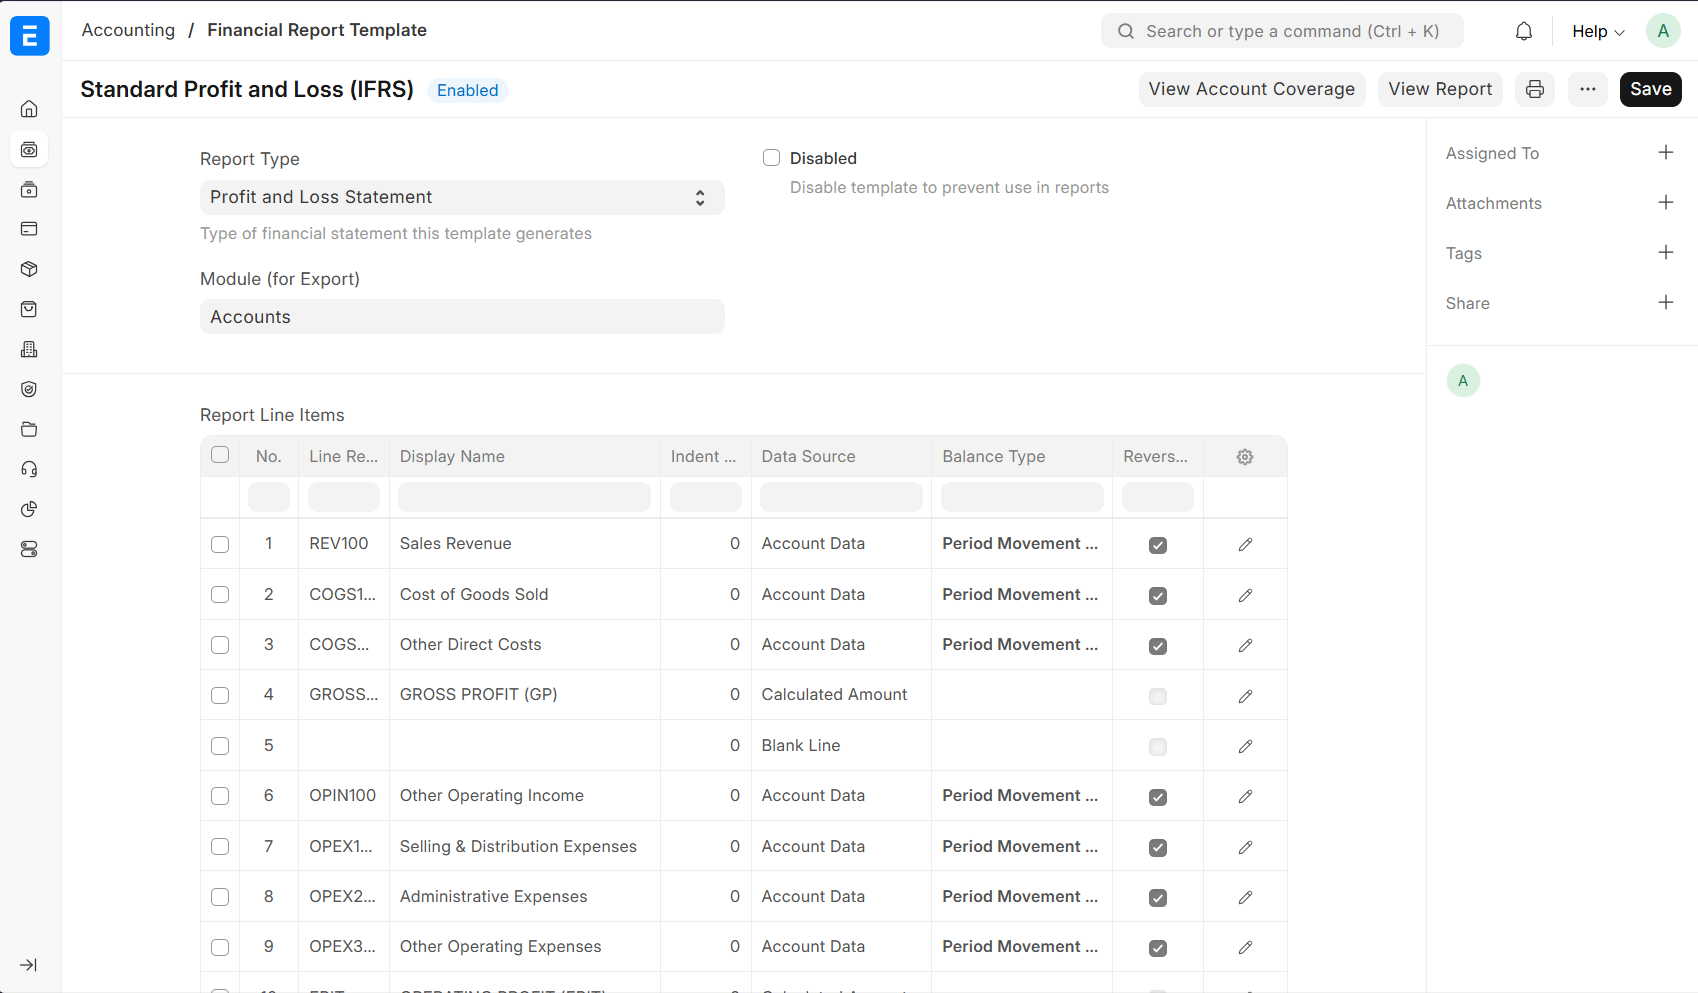
1. Financial Report Template
This is a report blueprint that defines:
- Template Name: Descriptive name for identification (e.g., "Monthly P&L")
- Report Type: Balance Sheet, Profit & Loss, Cash Flow, or Custom
- Rows: The individual lines that make up the report
2. Financial Report Row (Child Table)
Each row in template represents a line in the financial report:
- Display Name: What appears in the report (e.g., "Total Revenue")
- Reference Code: Short code for calculations (e.g., REV100)
- Data Source: Where the numbers come from:
- Account Data: Pulls balances from Chart of Accounts
- Calculated Amount: Uses formulas to compute values based on other rows
- Visual Elements: Blank lines or section headers for formatting
- Formatting: Bold, colors, indentation for professional appearance
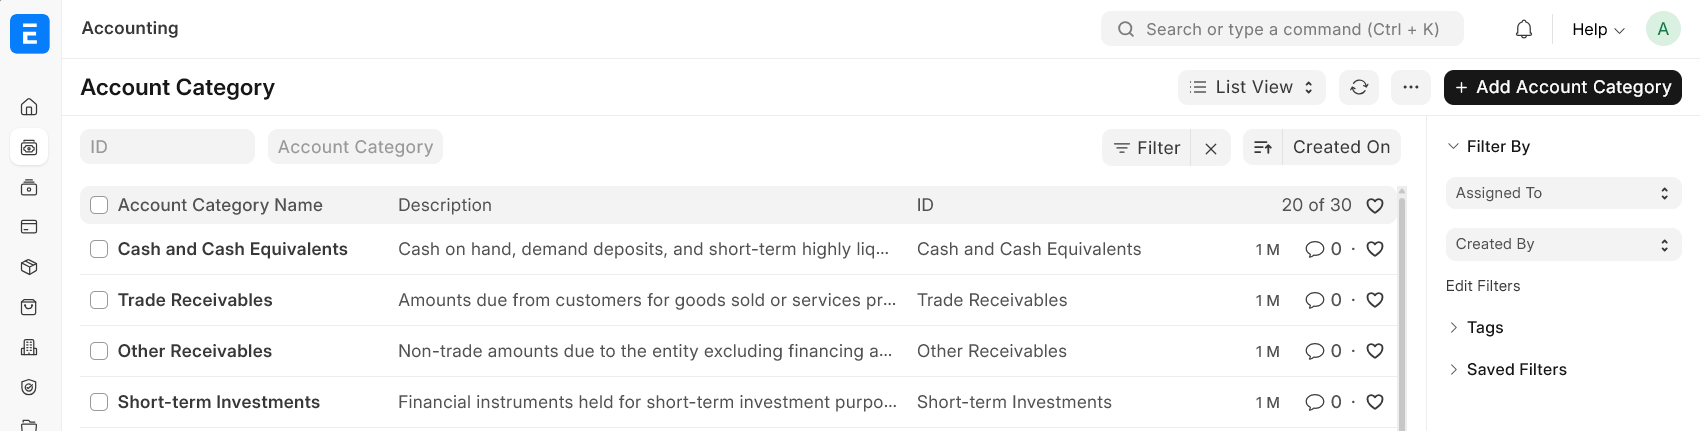
3. Account Category
Classification system for accounts that enables standardized filtering across companies.
Examples:
- Cash and Cash Equivalents: Bank accounts, cash, short-term deposits
- Trade Receivables: Customer invoices and receivables
- Operating Expenses: Office rent, utilities, salaries
- Revenue from Operations: Sales and service income
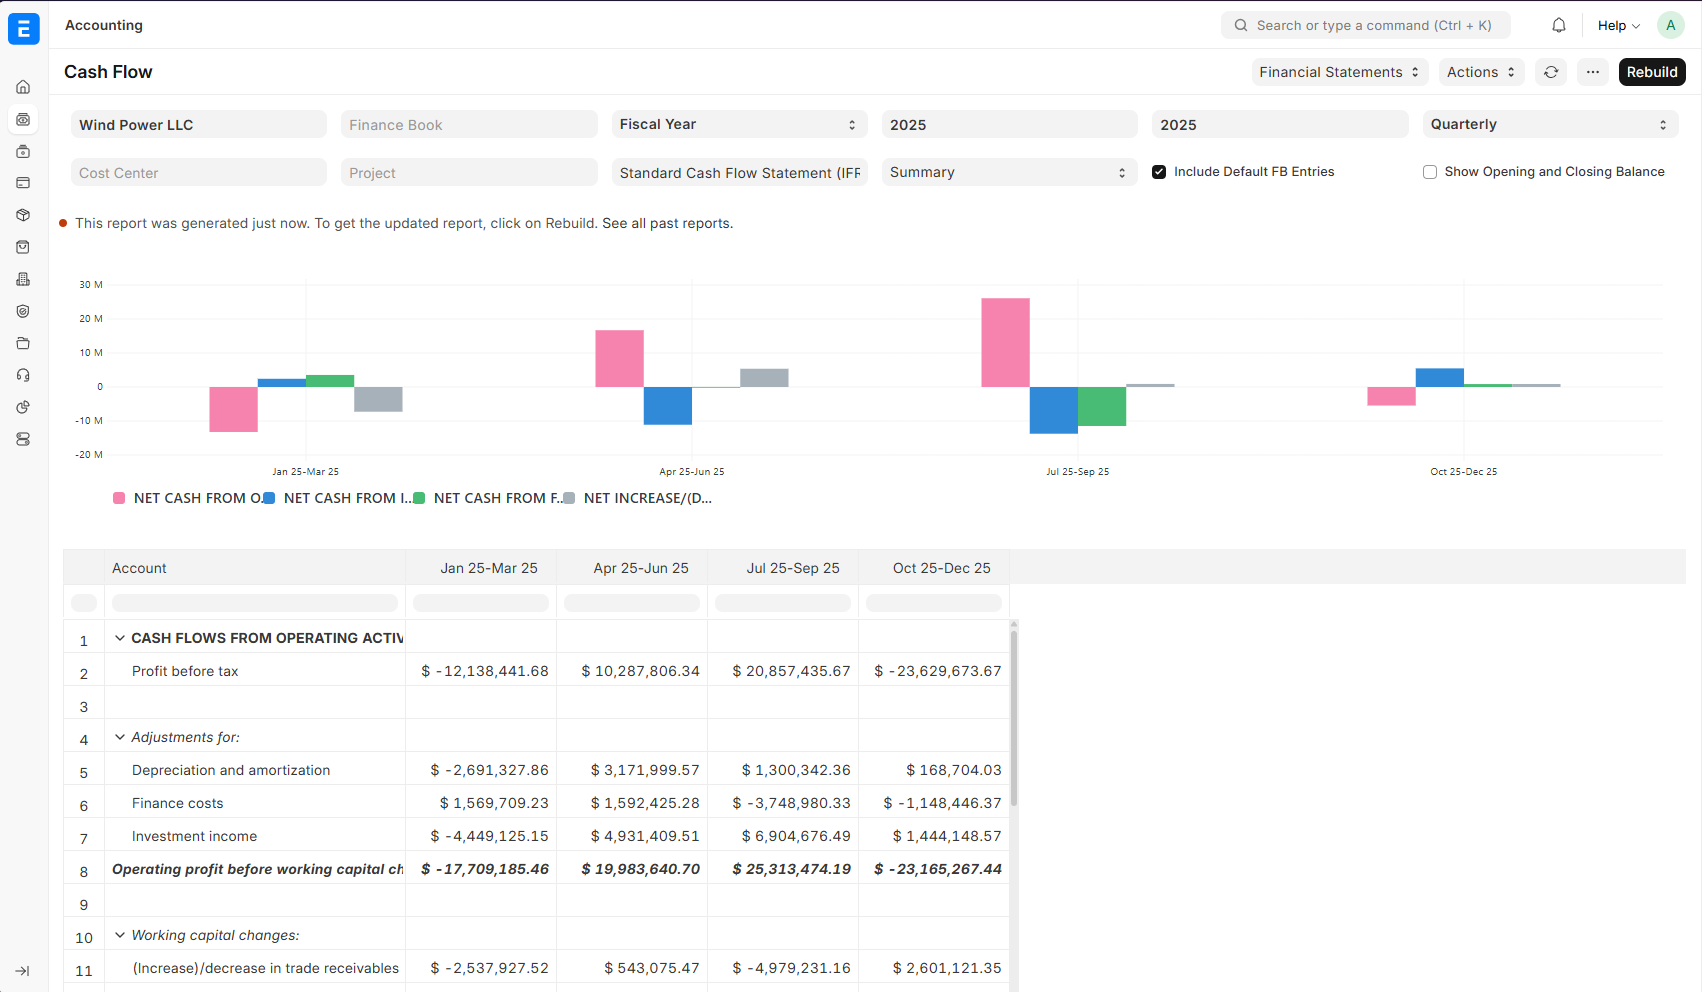
How to Get Data for Report
1. Account Data - Pull from Chart of Accounts
This gets actual balances from accounts. One can filter accounts by category or specific criteria.
Simple Example: Get all cash balances
- Set filter to:
Cash and Cash Equivalentscategory - Choose balance type:
Closing Balance(balance at end of period)
Advanced Example: Get only sales-related expenses
- Filter: Operating Expenses that contain "Sales" in the name
- This might include: "Sales Commission", "Sales Travel", "Sales Training"
Balance Types Explained:
- Opening Balance: Balance at the start of the period
- Closing Balance: Balance at the end of the period
- Period Movement: How much changed during the period
Easily check account coverage for rows to ensure all relevant accounts are included.
2. Calculated Amount
Use this to add, subtract, or calculate percentages using other rows in template.
Simple Examples:
- Total Assets:
CURRENT_ASSETS + NON_CURRENT_ASSETS - Gross Profit:
REVENUE - COST_OF_GOODS_SOLD - Profit Margin:
(NET_PROFIT / REVENUE) * 100
Smart Calculations (prevents division by zero):
(GROSS_PROFIT / REVENUE) * 100 if REVENUE != 0 else 0
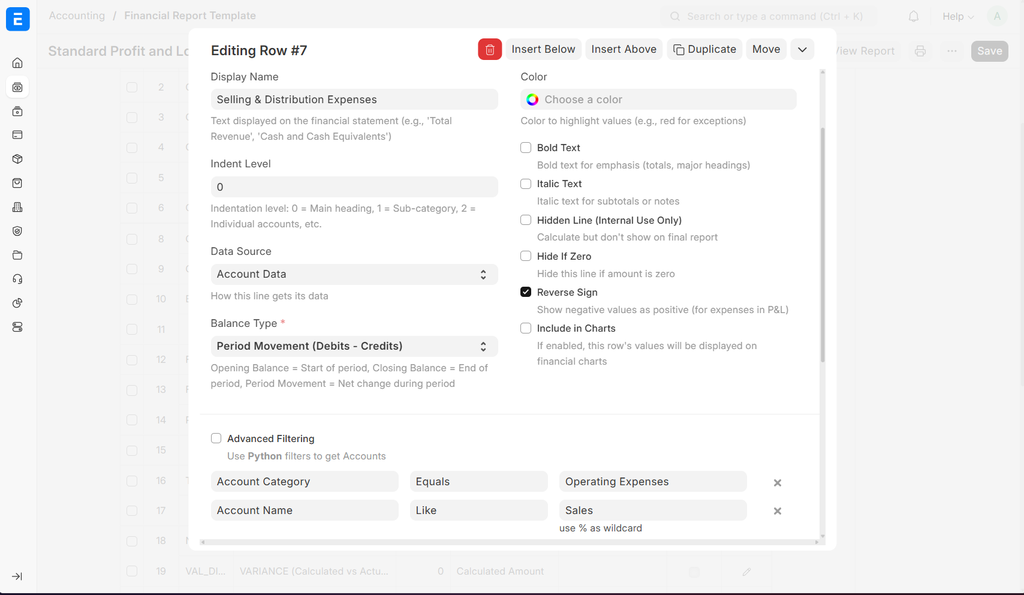
3. Visual Elements
Blank Line: Add space between sections for better readability. Display name can still be given. Eg: Bold Text like "ASSETS" or "LIABILITIES" to organize report.
Column Break: Create multi-column or horizontal layouts. Display name acts as the header for the new column.
Section Headers: Used in conjunction with Column Breaks to separate different sections horizontally. Eg. Keep Totals aligned with each other in multi-column layouts.
How to Assign Categories to Accounts
Method 1: One by One Go to Accounts -> update Account Category field
Method 2: Bulk Assignment using Data Import Tool
Making Reports Look Professional
Text Formatting
Make reports easy to read and professional:
- Bold Text: Say for main headings like "TOTAL ASSETS" or "NET PROFIT"
- Italic Text: Say for subtotals and calculated amounts
- Colors: Highlight important figures (red for losses, green for profits)
- Indentation: Create visual hierarchy (main items flush left, sub-items indented)
- Hide Empty Rows: Don't show accounts with zero balances to keep reports clean
- Reverse Signs: Show expenses as positive numbers (makes P&L easier to read)
- Include in Charts: Select which rows to include in automatic chart generation
Advanced Features
Easily build advanced templates by adding calculated rows
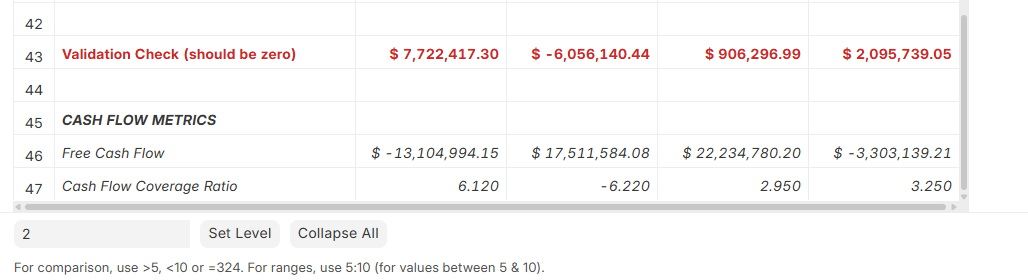
Balance Validation:
Say add a check that Assets = Liabilities + Equity
Ratios:
- Current Ratio: Current Assets ÷ Current Liabilities
- Profit Margin: Net Profit ÷ Revenue × 100
- Debt Ratio: Total Debt ÷ Total Equity
Built-in Validations
The system automatically checks your templates to prevent errors:
What Gets Checked
Reference Codes:
- Must be unique (can't have two REV100 codes)
- Must start with a letter and contain only letters, numbers, and underscores
- Example:
- ✅ REV100, ASSET1
- ❌ 100REV, ASSET-1
Calculations:
- Checks that references to a row actually exist
- Prevents circular references (A depends on B, B depends on A)
- Makes sure parentheses match up:
- ✅
(A + B) * C - ❌
(A + B * C
- ✅
Account Filters:
- Verifies that account categories exist
- Checks filter syntax is correct
Ready-to-Use Templates
ERPNext comes with professional templates to use immediately:
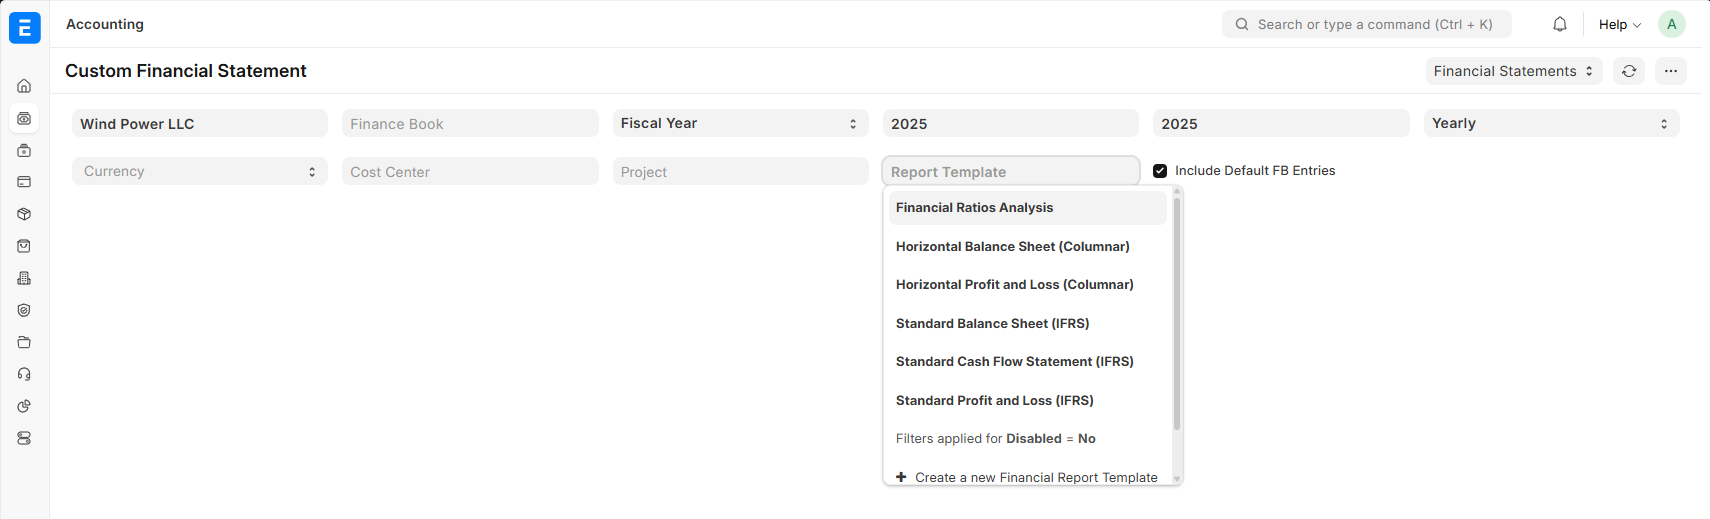
Customize these templates or create one from scratch.
Getting Started
Configure financial reports in three easy steps:
- Ensure Account Categories are mapped to Chart of Accounts
- Edit existing templates or create a new Financial Report Template
- Check for account coverage, formatting, and calculations