

















The Employee Analytics report shows how active employees are distributed across branches, grades, departments, designations or employment types. It shows a donut chart of headcount for the chosen parameter, along with a list of the employees.
To access the Employee Analytics report, go to:
Home > Tenure > Reports > Employee Analytics
1. Prerequisites
Before viewing the report, the following must exist:
- Employees with status Active
- Values set on the Employee for the parameter you want to analyse: Branch, Grade, Department, Designation or Employment Type
2. How to view the report
- Go to Employee Analytics.
- Select the Company.
- Select a Parameter.
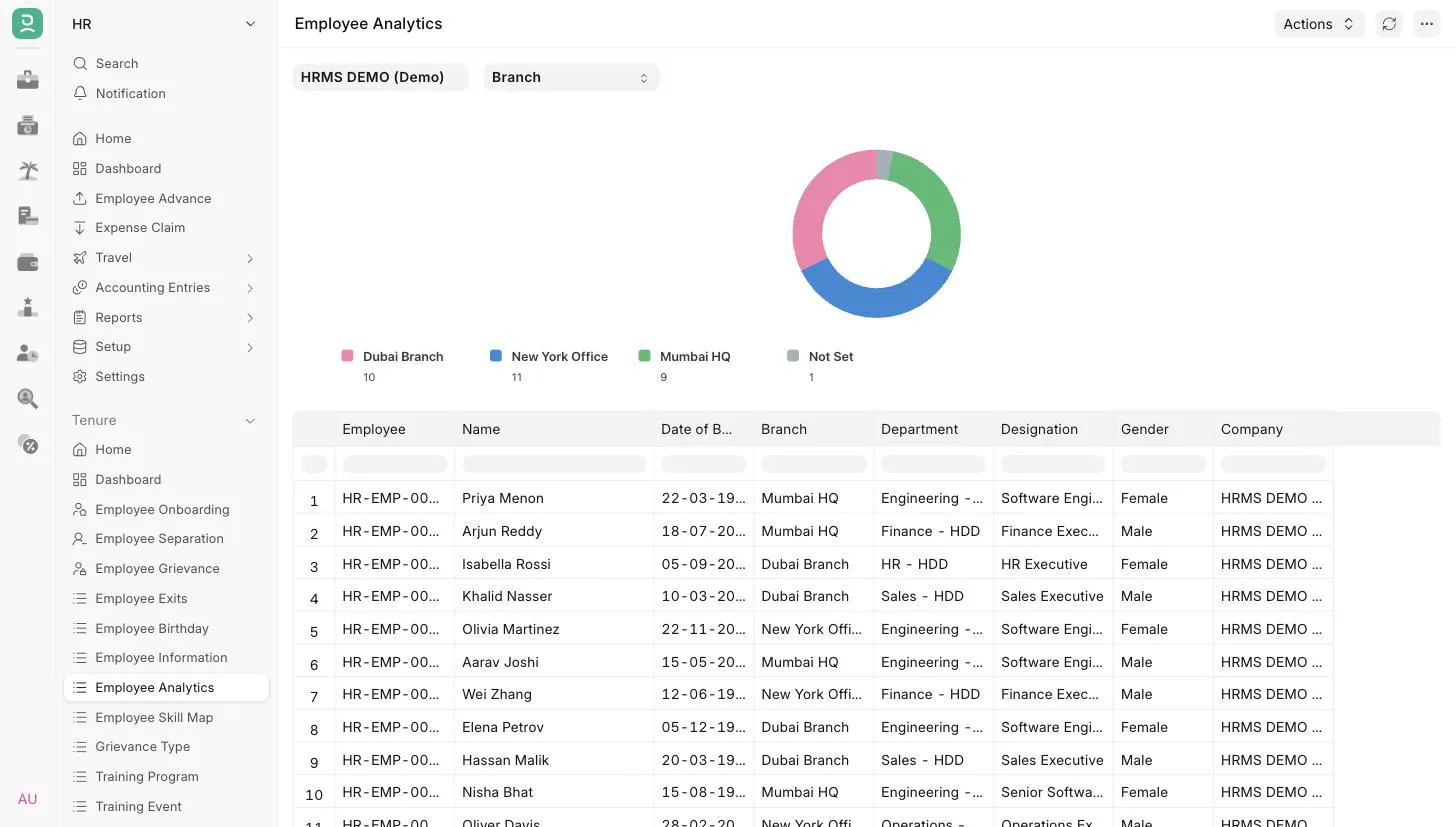 Employee Analytics
3. Filters
| Filter | Description |
|---|---|
| Company | Mandatory. Defaults to the user's default company. |
| Parameter | Mandatory. Branch, Grade, Department, Designation or Employment Type. |
4. Chart
The donut chart has one slice per value of the selected parameter that has at least one active employee in the company. For example, with Parameter set to Branch, each slice is a branch and its size is the number of active employees in that branch.
A Not Set slice shows the active employees of the company who have no value for the parameter.
5. Report columns
The table lists active employees of the company that have a value set for the selected parameter. Employees counted under Not Set in the chart are not listed.
| Column | Description |
|---|---|
| Employee | Employee ID. |
| Name | Employee name. |
| Date of Birth | Date of birth. |
| Branch | Branch. |
| Department | Department. |
| Designation | Designation. |
| Gender | Gender. |
| Company | Company. |
The table does not have a separate column for Grade or Employment Type. Use the chart, or the Employee Information report, to see those values per employee.